
Link to the original MSDN publication:
https://docs.microsoft.com/en-us/archive/blogs/samlester/sql-server-dba-morning-health-checks
The complete script can be downloaded from GitHub.
https://github.com/PatrickKeisler/SQLMorningHealthChecks
The PowerShell script will help answer the following questions about your SQL Server.
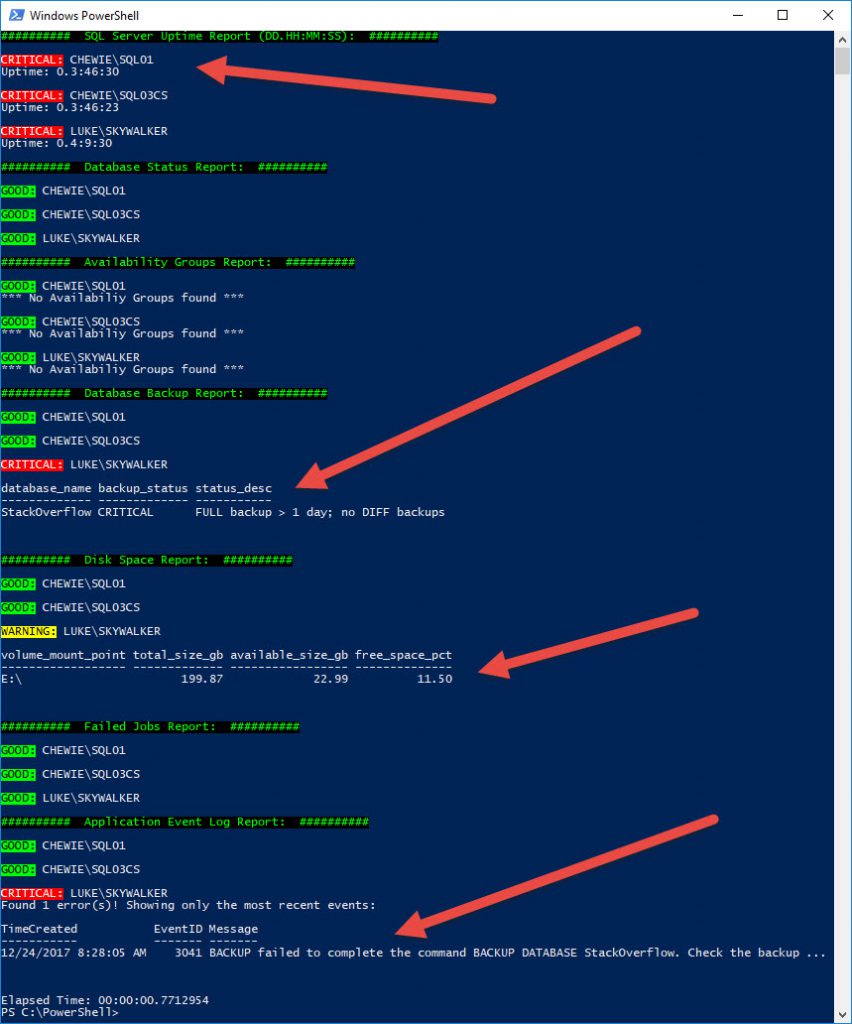
- What is the uptime of each SQL Server?
- What is the status of each SQL service (engine, agent, full text, etc)?
- What is the status of each cluster node (AG or FCI)?
- What is the status of each database?
- What is the status of each Availability Group?
- What is the backup status of each database?
- What is the available disk space?
- Are there any SQL Agent failed jobs in the last 24 hours?
- What errors appeared in the SQL errorlog in the last 24 hours?
For each check, there are certain thresholds that are defined; each of which can be changed.
- What is the uptime of each SQL Server?
- CRITICAL = < 6 hours
- WARNING = > 6 hours and < 24 hours
- GOOD = > 24 hours
- What is the status of each SQL service (engine, agent, full text, etc)?
- CRITICAL = Not running with automatic startup
- GOOD = Running
- What is the status of each cluster node (AG or FCI)?
- CRITICAL = Down
- GOOD = Up
- What is the status of each database?
- CRITICAL = Suspect
- WARNING = Restoring, recovering, recoery_pending, emergency, offline, copying, or offline_secondary
- GOOD = Normal
- What is the status of each Availability Group?
- CRITICAL = Not_healthy
- WARNING = Partially_healthy
- GOOD = Healthy
- What is the backup status of each database?
- CRITICAL = No FULL/DIFF/LOG, FULL > 7 days and DIFF > 2 days, LOG > 6 hours
- WARNING = FULL > 7 days and DIFF > 1 day, LOG > 3 hours
- GOOD = Normal
- What is the available disk space?
- CRITICAL = < 10%
- WARNING = > 10% and < 20%
- GOOD = > 20%
- Are there any SQL Agent failed jobs in the last 24 hours?
- CRITICAL = Failed
- WARNING = Retry or Canceled
- GOOD = Succeeded
- What errors appeared in the SQL errorlog in the last 24 hours?
- CRITICAL = Errors logged
- GOOD = No errors logged
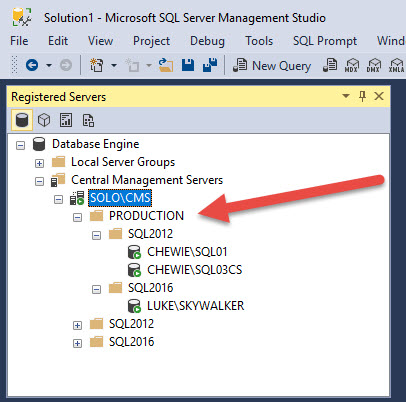
To scan a group of SQL Servers, you can provide a hard-coded server list, or you can point it to a Central Management Server (CMS) to dynamically get a list of SQL Servers.
The thresholds for CRITICAL, WARNING, and GOOD can be adjusted within each function. For the uptime example below, you would update the value “6” to some other number.
if ($upTime.Day –eq 0 –and $upTime.Hours –lt 6) {
  #critical
}
elseif ($upTime.Day –lt 1 –and $upTime.Hours –ge 6) {
  #warning
}
else {
  #good
}
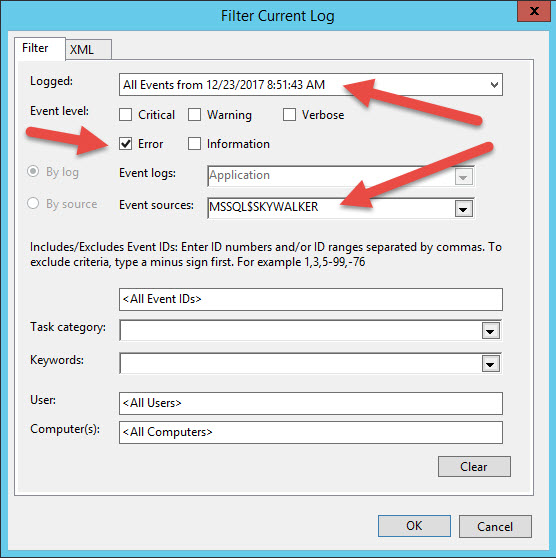
The Application Event Log Report pulls data from Windows Applicaiton log, because it’s more efficient than quering the SQL Errorlog.
Get-WinEvent –ComputerName 'LUKE' `
  –FilterHashtable @{ `
    LogName='Application'; `
    Level=2; `
    StartTime=((Get-Date).AddDays(-1)); `
    ProviderName='MSSQL$SKYWALKER' `
  }
The sample code above is the same as using the following filters (below) within Event Viewer.
Additional references:
https://blog.netnerds.net/smo-recipes/central-management-server/
https://docs.microsoft.com/en-us/sql/relational-databases/server-management-objects-smo/sql-server-management-objects-smo-programming-guide
https://docs.microsoft.com/en-us/sql/database-engine/configure-windows/database-engine-service-startup-options