The year is 2015, and I’m still surprised by how many people have never heard of SQL Nexus; although it has been available since approximately 2008. SQL Nexus is a tool that that is designed to collect and analyze data to help you troubleshoot SQL Server performance issues. There are plenty of tools on the market that can easily do this, but this one is free and it can be used to monitor SQL Server 2005 through SQL Server 2014. The tool was originally created by the SQL Server product support team, and is still used today as the primary tool for collecting and analyzing performance issues.
SQL Nexus does not require you to install anything on the server that you intend to monitor, but you will need to copy some data collector files to it. The collector files just run SQLDIAG and some other TSQL scripts to collect data from your monitored server. Below is a list of some of the data that is collected.
- Windows Performance Monitor counters
- Windows event logs (system, application, and security logs)
- Windows configuration settings
- SQL Server trace events
- SQL Server wait stats
- SQL Server blocking info
- SQL Server configuration settings
- SQL Server dump files
Once the data is collected from the monitored server, you copy all the data files back to another machine for analysis within SQL Nexus.
Installation & Setup
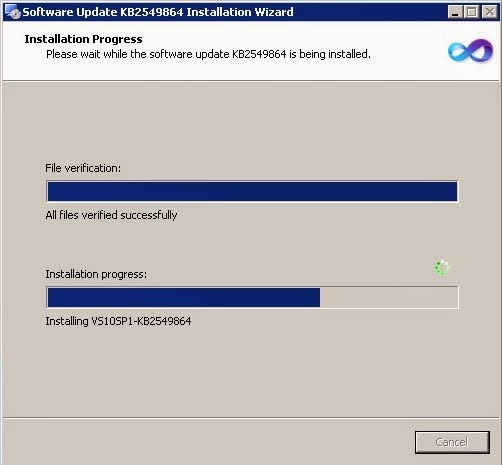
There are a few requirements to setting up SQL Nexus. First, make sure you have the .NET Framework 4.0 installed. Next, SQL Nexus requires an instance of SQL Server to store and analyze the imported data. Ideally, you would put it on a TEST server, but you can also use SQL Server Express Edition running on your workstation. If your workstation that will do the analysis is running SQL Server 2008 or SQL Server 2008 R2, then download and install the Microsoft Report Viewer 2010 control. If your workstation is running SQL Server 2012 or higher, then you can skip this step. Regardless of the version, download and install the Report Viewer hotfix. The hotfix addresses some bugs that will prevent some of the SQL Nexus reports from working properly.
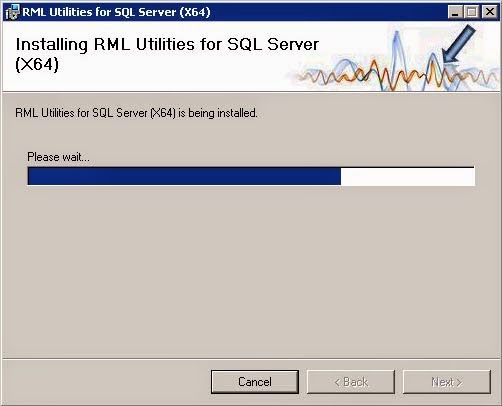
Next, download and install the RML Utilities.
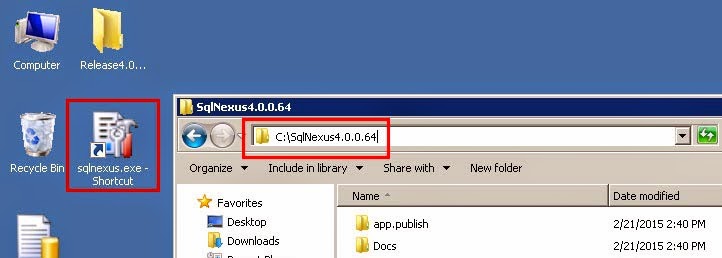
Now that you have all the prerequisites installed, download the latest version of SQL Nexus from the CodePlex website. Just uncompress the Release4.0.0.64.ZIP file and place on your desktop. Within the Release4.0.0.64 folder, you should see a subfolder called DataCollectors, and another compressed file called SqlNexus4.0.0.64.ZIP. Uncompress that zip file and place it on your workstation C drive. The SqlNexus4.0.0.64 folder will contain the SQL Nexus executable and all the other files needed to analyze the collected data. From there, you can create a shortcut on your desktop or your start menu for sqlnexus.exe.
The DataCollectors subfolder contains the data collector files. There is one ZIP file for each version of SQL Server. In our example, we want to monitor a SQL Server 2012 instance, so we need to uncompress the PerfStatsScript2012.zip file. Once uncompressed, you will see 3 CMD files and their accompanying XML configuration files.
- StartSQLDiagTrace2012.cmd & SQLDiagPerfStats_Trace2012.XML
- StartSQLDiagDetailed_Trace2012.cmd & SQLDiagPerfStats_Detailed_Trace2012.XML
- StartSQLDiagForReplay2012.cmd & SQLDiagReplay2012.XML
StartSQLDiagTrace2012.cmd will likely be the batch file you will run most often. By default, it will collect the most common Performance Monitor counters and run a SQL trace to capture batch level commands. The StartSQLDiagDetailed_Trace2012.cmd batch file will capture the same counters, but it will also capture statement level commands and the Showlan Statistics Profile. The StartSQLDiagForReplay2012.cmd batch file captures the trace events needed to replay it against another server.
Collecting Data
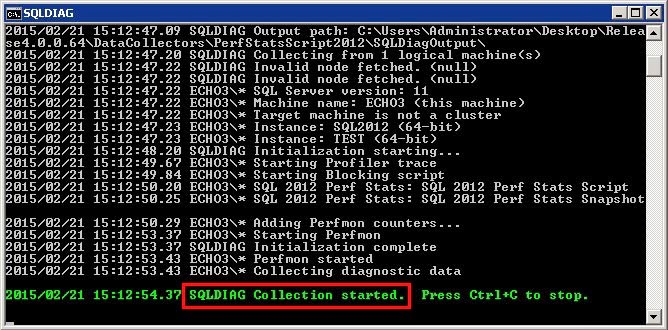
To monitor our server, copy the PerfStatsScript2012 subfolder to the SQL Server. This folder cannot be on a network drive; it must be local to that server. It’s best if you do not place it on the C drive or on a drive that hosts your transaction log (LDF) files. The data collector can quickly capture a lot of data, so you want to avoid filling up the C drive or impacting the write performance of your transaction log files. Open a command prompt to that folder location and run StartSQLDiagTrace2012.cmd. SQLDiag will start up the collectors based on what’s in the XML configuration file. Once you see the green line that says “SQLDIAG Collection started”, then you can try to reproduce your performance problem on the server.
Once you are done, just press Ctrl+C to shut down the data collector. Sometimes it will take several minutes for the collector to fully shutdown, so be patient and do not press Ctrl+C more than once.
You can leave the data collector running for a period of time, but please keep in mind that it can collect a lot of data and the SQL trace can potentially impact your performance. It’s usually best to start it, reproduce your performance issue, and then shut down the data collector.
After you stop the data collector, you will see a sub folder called SQLDiagOutput. Copy that entire folder back to your workstation to begin the analysis of the data.
Analysis of the Data
Run sqlnexus.exe using the shortcut you placed on your desktop. The first step is to specify which SQL Server will be used to perform the analysis. Enter the name of your SQL Server and click Connect.
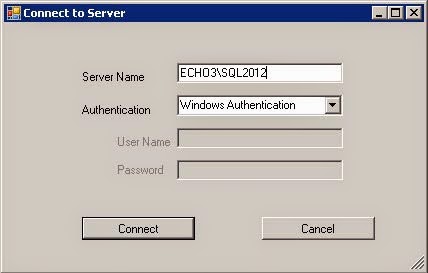
The tool will automatically create a sqlnexus database on that SQL Server.
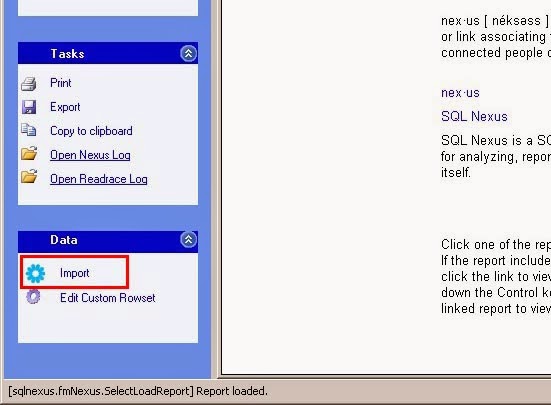
Now we need to import the data we collected. In the bottom left hand pane, click Import.
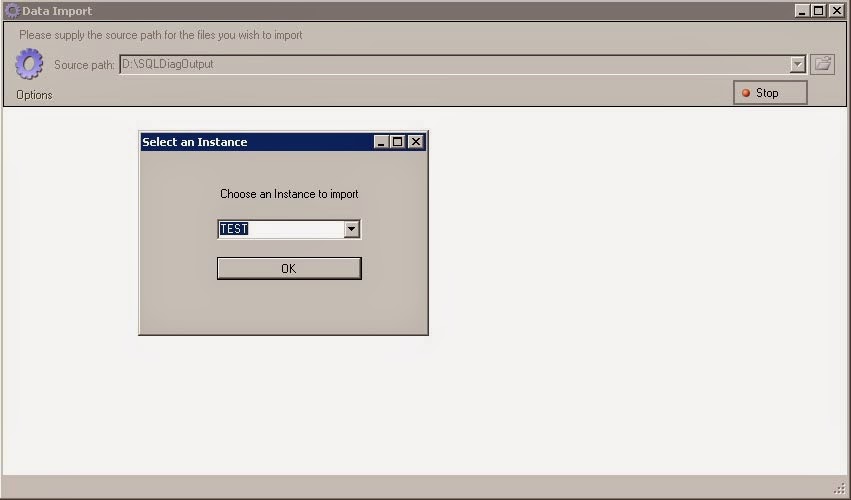
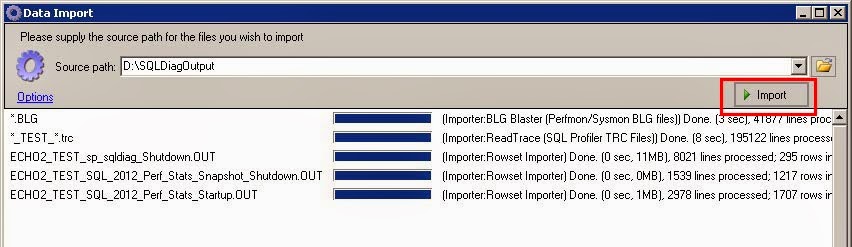
Choose the location of the SQLDiagOutput folder and then click the green Import button. If the collector captured data for more than one instance on the monitored server, then you will get a popup window asking which instance you want to analyze. Choose your instance and click OK.
Depending on how much data was collected, the import process could take a while; maybe even several hours. Be patient and just give it time to complete. While it’s running the Import button will change to a red Stop button. Once it’s complete, it will turn back to a green import button.
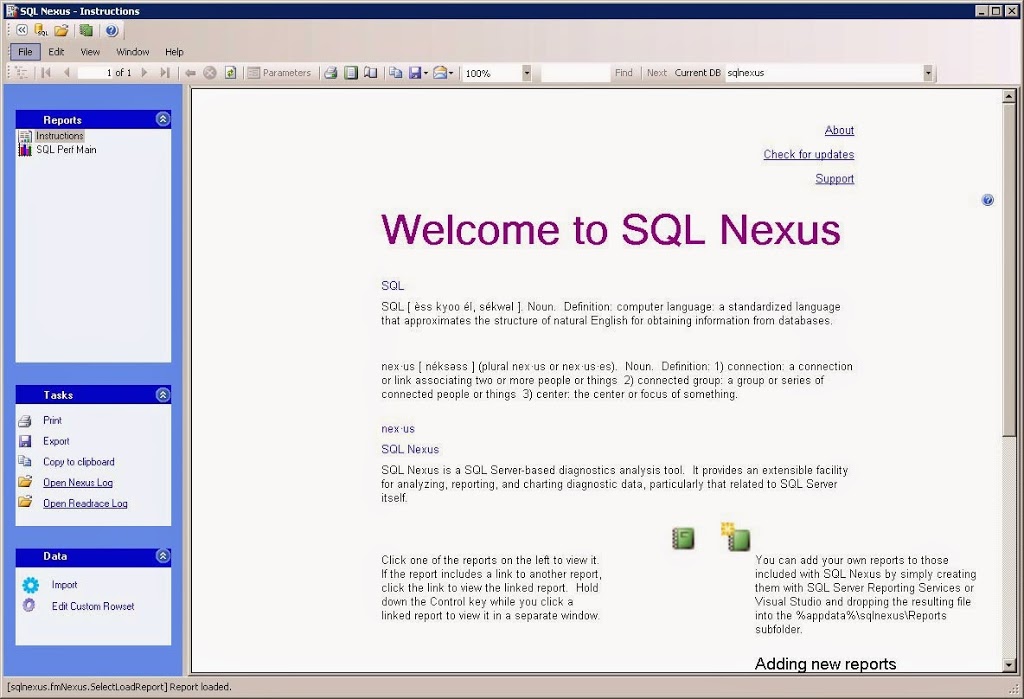
Now just close the Data Import window. In the SQL Nexus window, click SQL Perf Main from the upper left hand pane. This is main page where we will drill into the various reports.
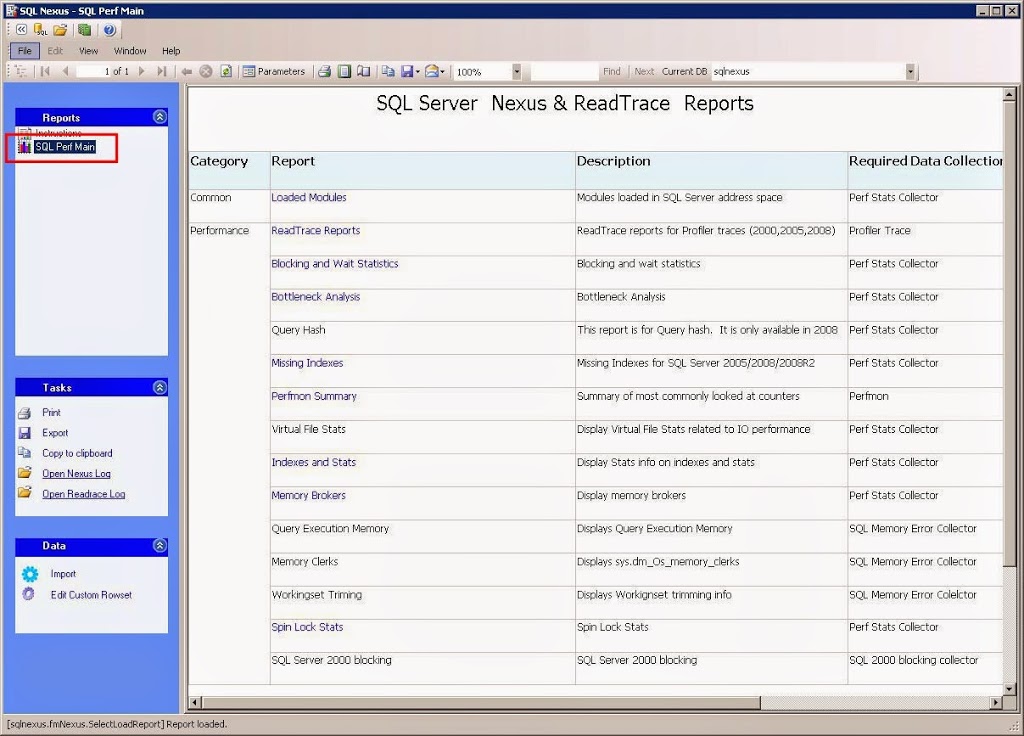
Each report name that appears in blue is a hyperlink to that report. Report names that are in black did not have any data to analyze. Most reports have a summary of what they display, but some do not, like the Bottleneck Analysis report. It shows CPU utilization by SQL Server (yellow) and everything else (purple). If CPU utilization is higher for purple, then you could assume the CPU is being used by a process other than SQL Server.
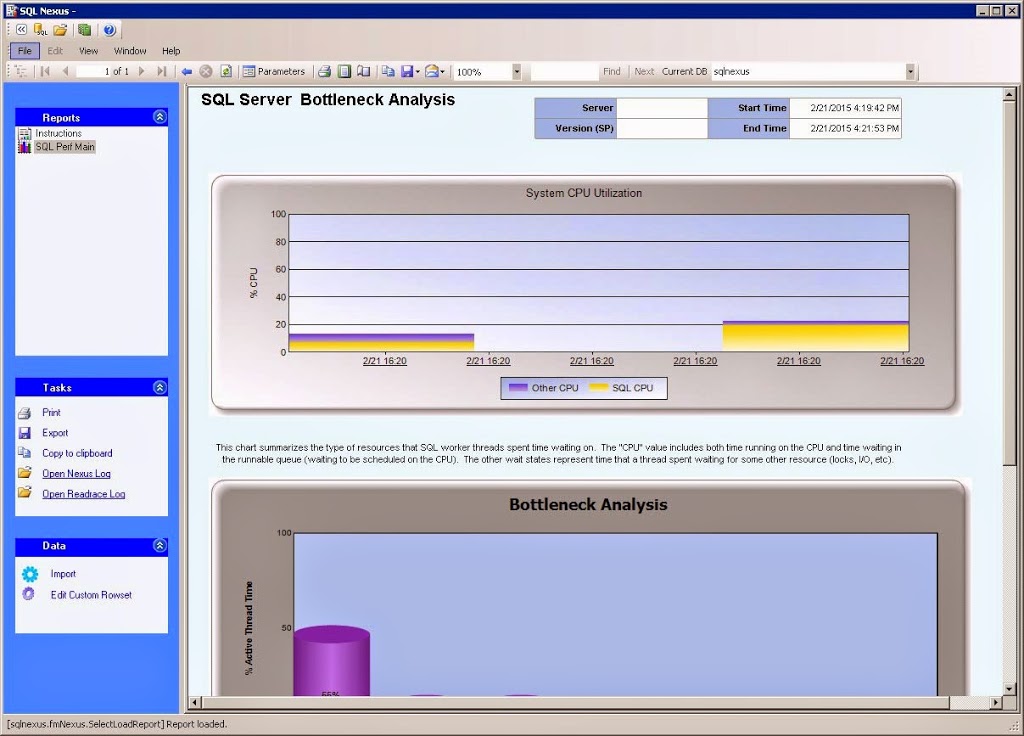
If SQL Server is the higher consumer of CPU (yellow), then look further down on that page to see the wait stats analysis. This is the waits that accumulated while the data collector was running. This will help guide you toward what SQL Server was waiting on while executing the queries. You can click on each wait type to see more details about each wait. If you need to the definition of a wait stat, then look at Books Online.
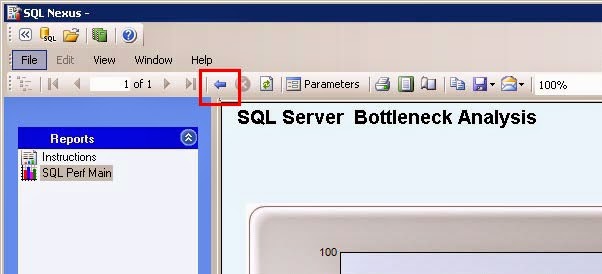
To go back to the previous page in a report, just click the blue left arrow in the toolbar.
The Perfmon Summary report shows an aggregation of the counters collected from Performance Monitor. They are broken out by CPU, IO, Memory, and Network.
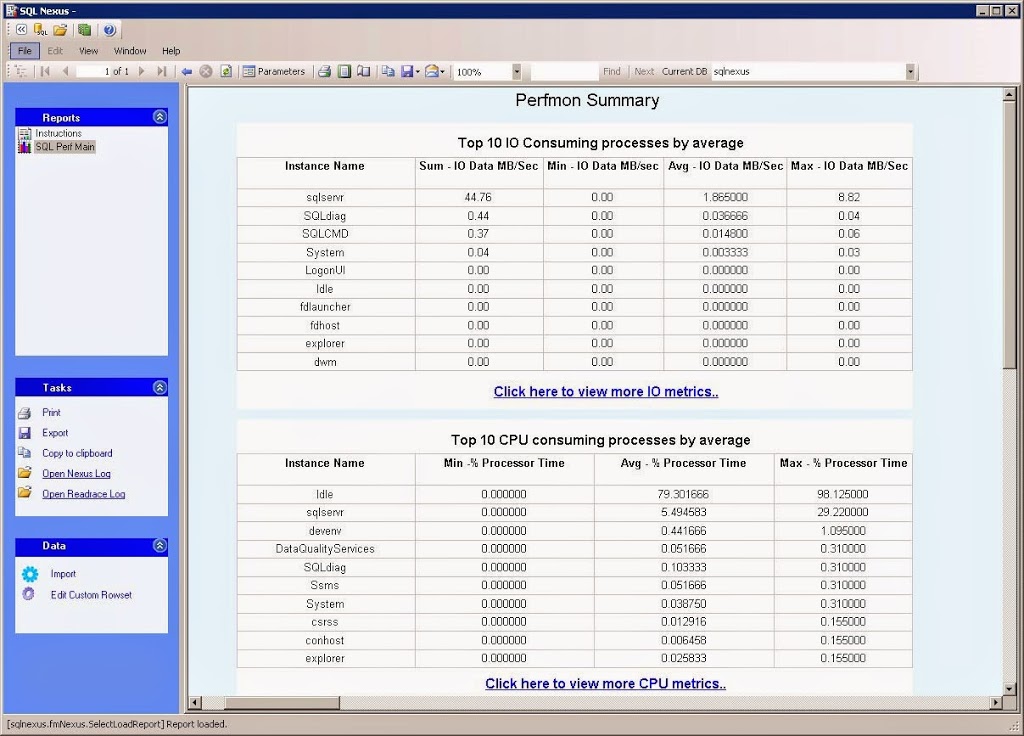
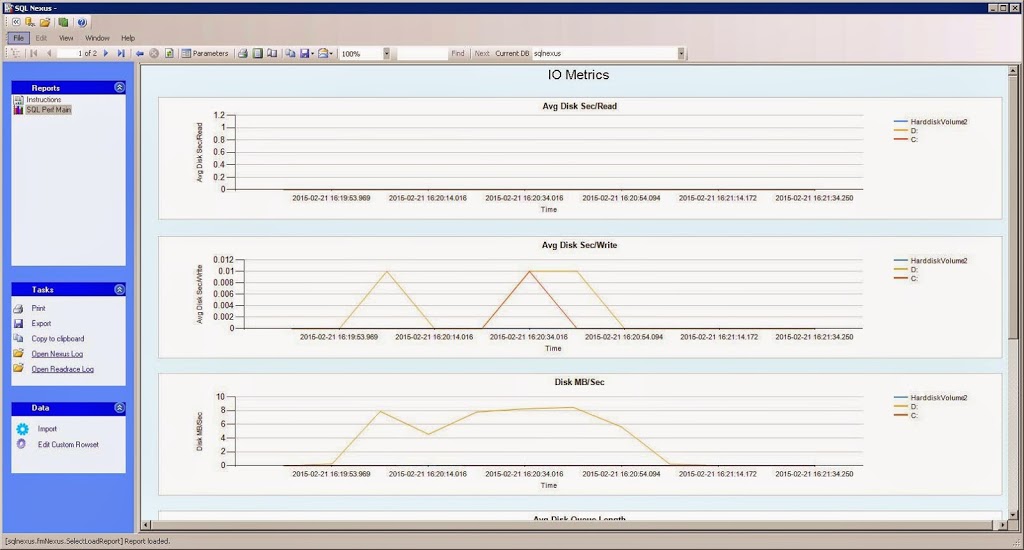
You can click on each blue link to get the graphical view. For example, in the IO report details you can see the Avg Disk Sec/Read and the Avg Disk Sec/Write which will show you how fast your IO subsystem is responding to requests.
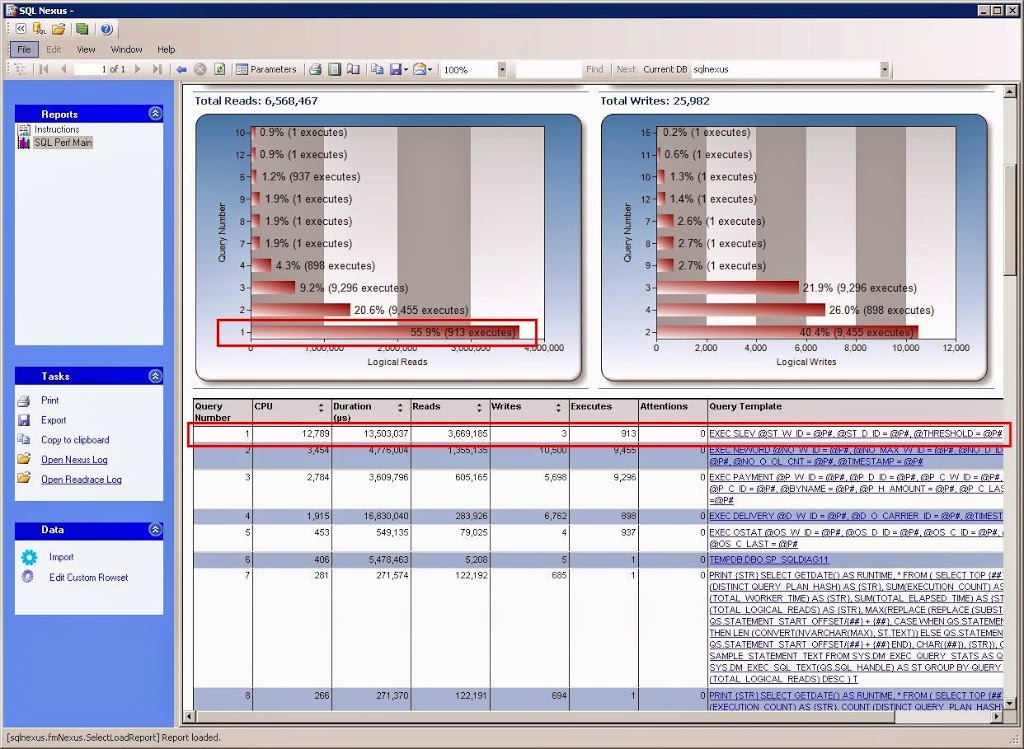
The ReadTrace Report is really my favorite group of reports. The main report gives you a graphical view of the overall utilization of resources.
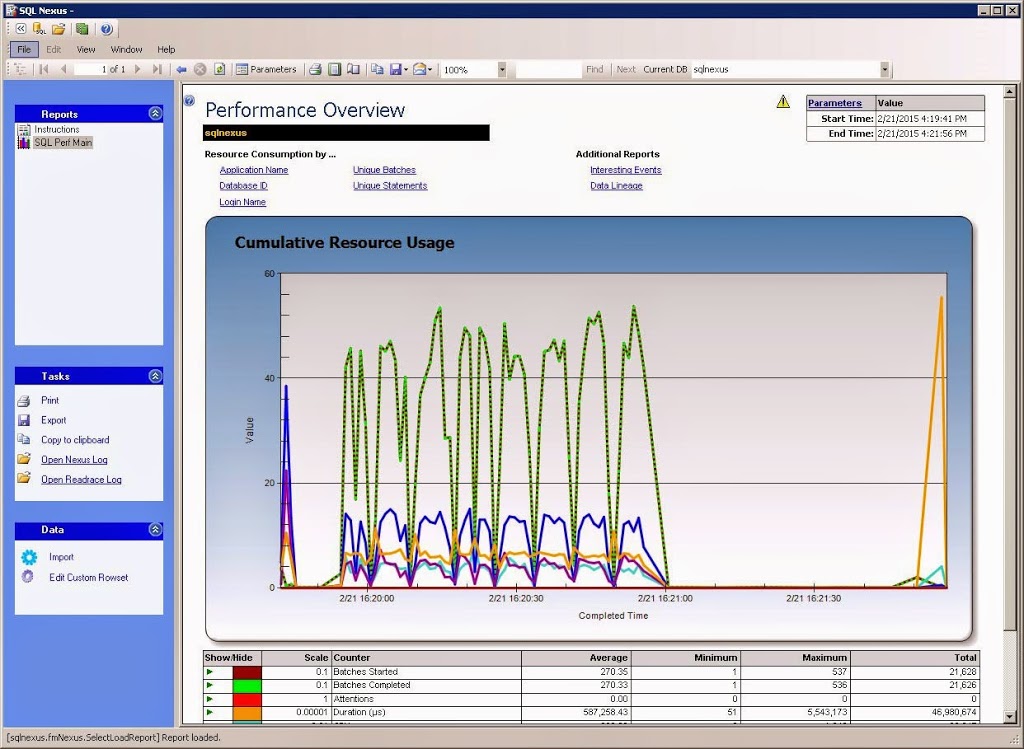
From here, you can drill into the data from various points, such as application name, database id, or login name. The Unique Batches report will show you the top TSQL batches by CPU, reads, writes, and duration. Each graph is inverted, so the one on the bottom is the largest consumer of that resource.
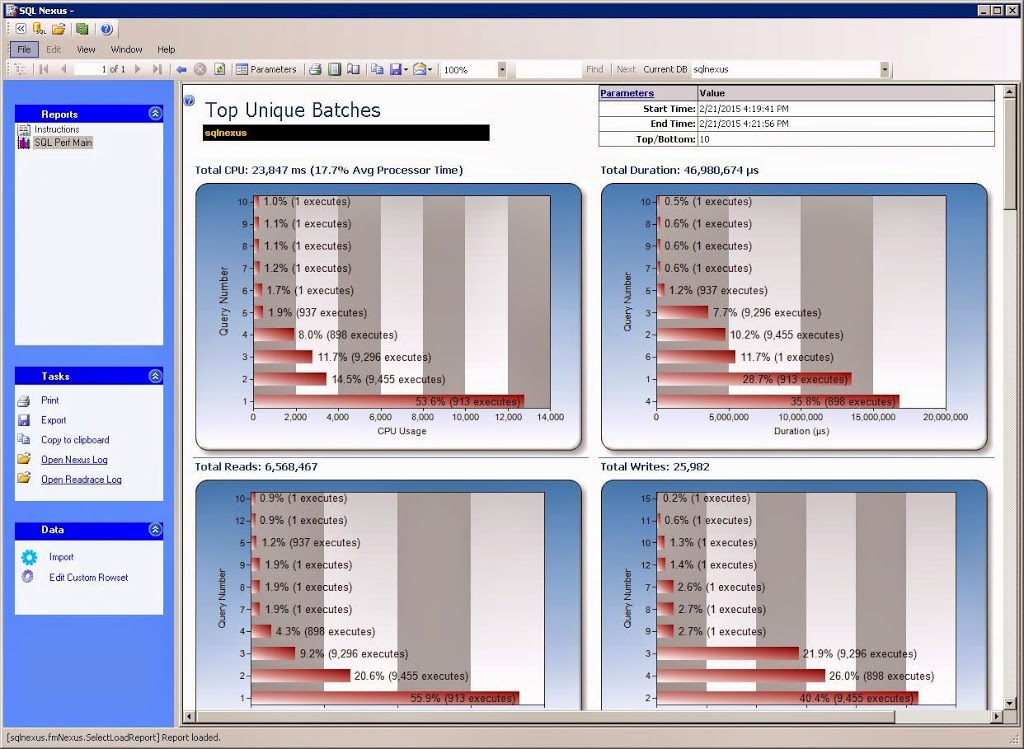
On the Y axis of each graph you will see a number. That number corresponds to the TSQL batch command that is listed further down on the page. For example, Query #1 was the largest consumer of reads. From that table, I can see that was a stored procedure named “SLEV”.
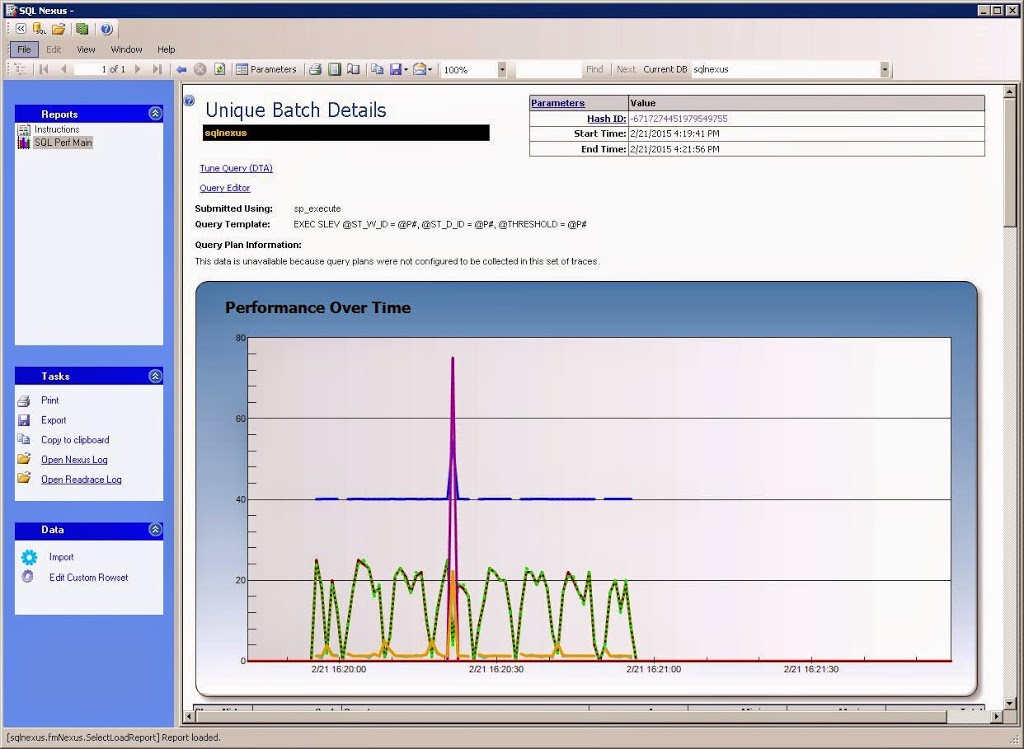
You can click on each batch to get even more detail about it in a graphical view over time.
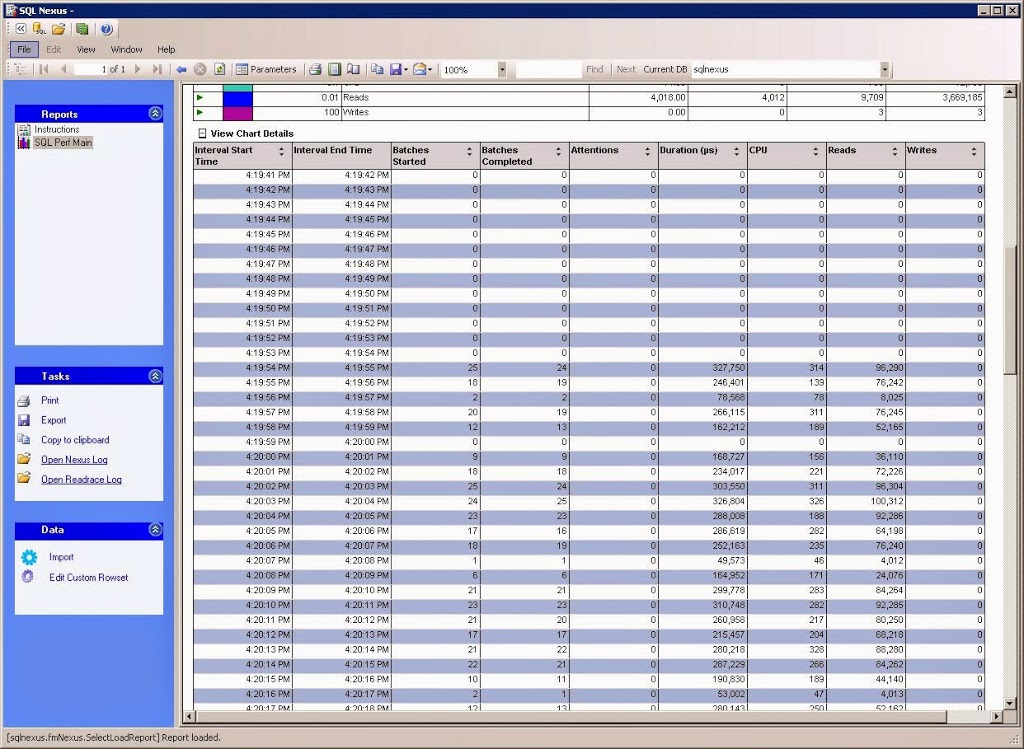
Below the chart, you can click the + button next to “View Chart Details” to get the detailed info about that TSQL batch. This will display the number executions, CPU, reads, and writes, broken out by interval.
There are many more reports, so be sure to click through each one to view the information they provide.
Customize the Data Collector
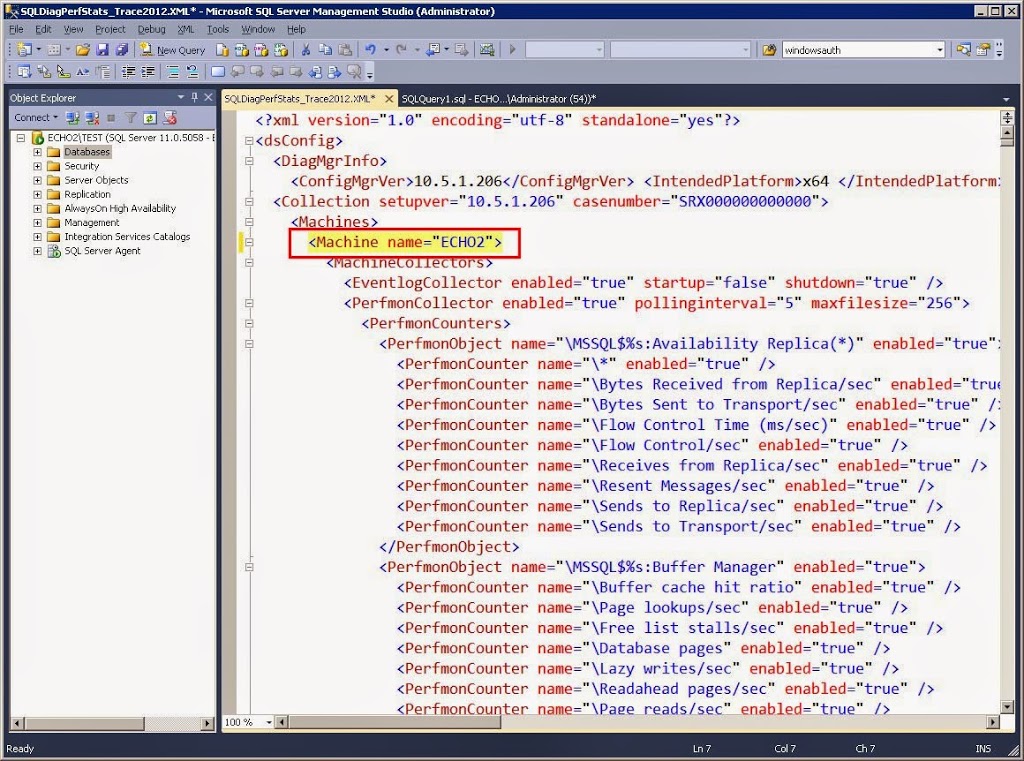
By default, the data collectors will capture only a subset of perfmon counters and SQL trace events, and it will do that for ALL instances on the server being monitored. If you need to add or remove certain counters or monitor only a specific SQL Server instance, then you will need to edit the SQLDiagPerfStats_Trace2012.XML configuration file. You can open the file in Notepad, but opening it in SQL Server Management Studio color codes it and make everything easier to read.
The top section of the XML file is for the perfmon stats, which takes up about 75% of the file. The bottom section is for the SQL Server trace events. All of the possible options are listed for every counter; however, the majority are set to disable. Therefore, to add additional counters, just search for the counter name and set the “enabled” value to “true”. For example, if you wanted to add the TSQL:StmtStarting and TSQL:StmtCompleted, then just scroll down to about line 2775 and change the enabled value to “true” and save the XML file. Now when you run the collector it will also collect those two trace events.
If you need to set the name of the server then about line 7 you will see Machine name=”.”. Change the “.“ to the actual server name. If the server being monitored is a Failover Cluster Instance, then you must enter the SQL Server Virtual Server Name.
If you need to set the SQL Server instance name, then about line 2564 you will see Instance name=”*”. Change the “*“ to the instance name. Only type the instance name here, not the ServerNameInstanceName. If your instance to monitor is the default instance, then enter “MSSQLSERVER“.
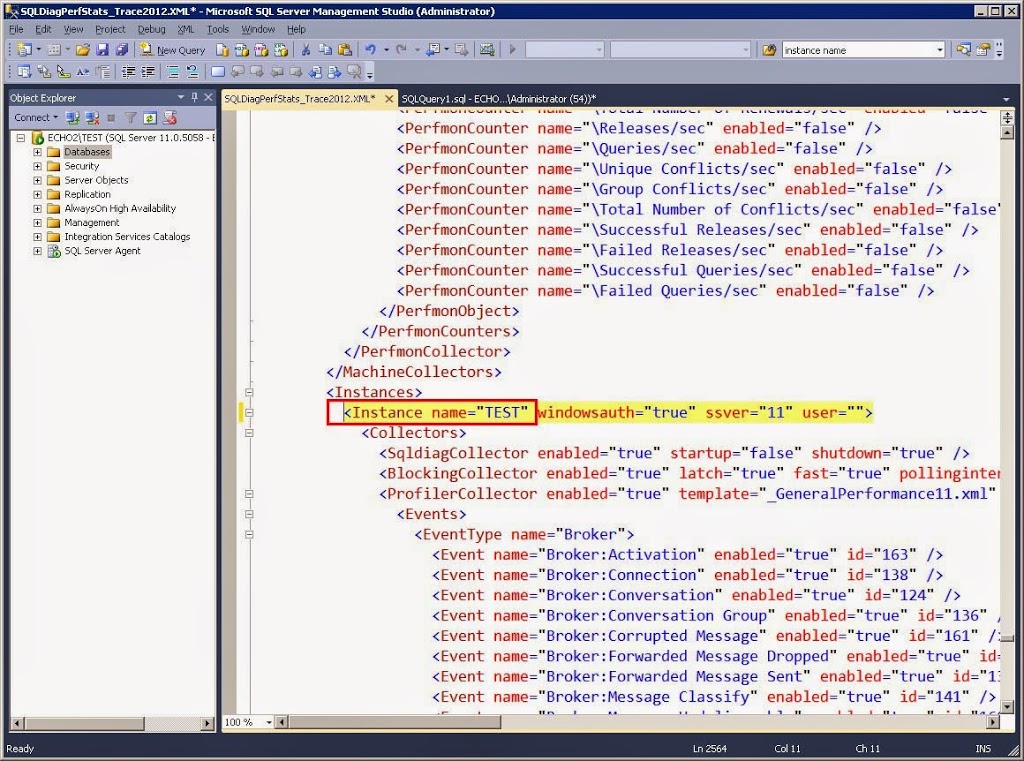
Also on the same line, the default authentication to connect to that instance of SQL Server is Windows Authentacation. If you need to use SQL Server Authentication, then set windowsauth to “false” and user to the sql server login name. When you run the StartSQLDiagTrace2012.cmd batch file, it will prompt you to enter the password for that account.
Other Hints and Tricks
Before collecting the data, you need to make sure the Windows account is a member of the local administrators group a member of the sysadmin server role for the server you want to monitor. If you use a SQL Server login to collect the SQL trace events, then it also has to be a member of the sysadmin server role.
Once the data collector is started on the monitored server, don’t log off. That will shut down the collectors and you will have to restart them again.
If you cannot stay logged into the server, then you’ll need to schedule the collection by modifying the StartSQLDiagTrace2012.cmd batch file using the /B and /E parameters for SQLDIAG or register it as a Windows service. Books Online has more information about those options.
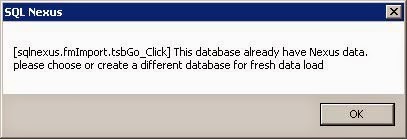
When you import data into SQL Nexus, it populates the tables in the sqlnexus database. If you already have data in the sqlnexus database, you’ll get the following error when attempting to import new data.
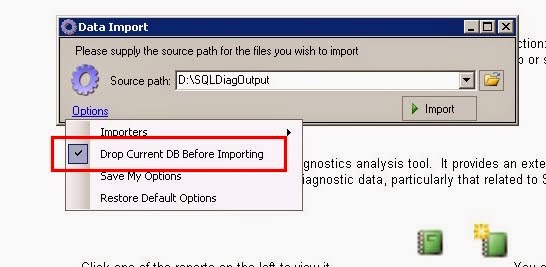
At this point, you will need to do one of two things: overwrite the existing data or create another sqlnexus database. To overwrite the existing database, click the Import link and then click Options. In the dropdown menu, just select “Drop Current DB Before Importing”. This will drop and recreate the sqlnexus database.
Keep in mind, sqlnexus is just another database on a SQL Server. If you want to keep that data for later analysis, you CAN backup that database before overwriting, or you can create a new database. Before clicking the Import link, click the database dropdown list on the tool bar. From there, you can select “<New Database>”. This just creates another database on your local SQL Server and will be the target of the imported data.
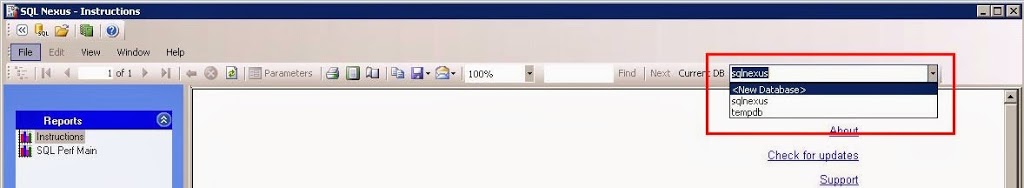
This is the way to go if you need to analyze data from multiple servers, because you can use the dropdown database list to change to a different sqlnexus database and view the reports.
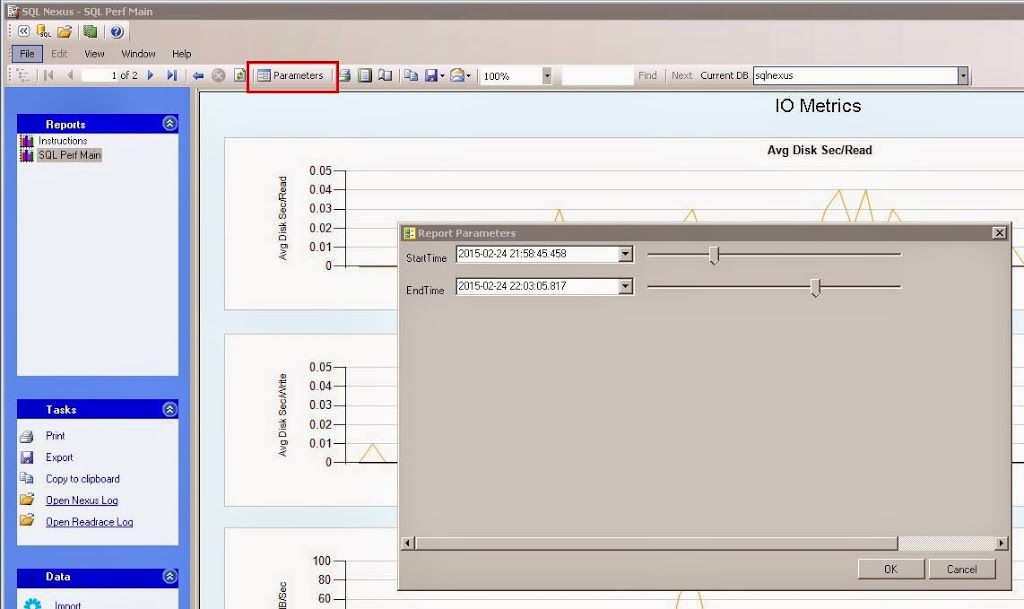
Report Parameters is another feature that people tend to overlook. When viewing a report, such as the IO Metrics, click Parameters button on the toolbar. In the popup window, you can change the start and end timeframe that you want to view. This is extremely helpful if your data spans hours or even days.
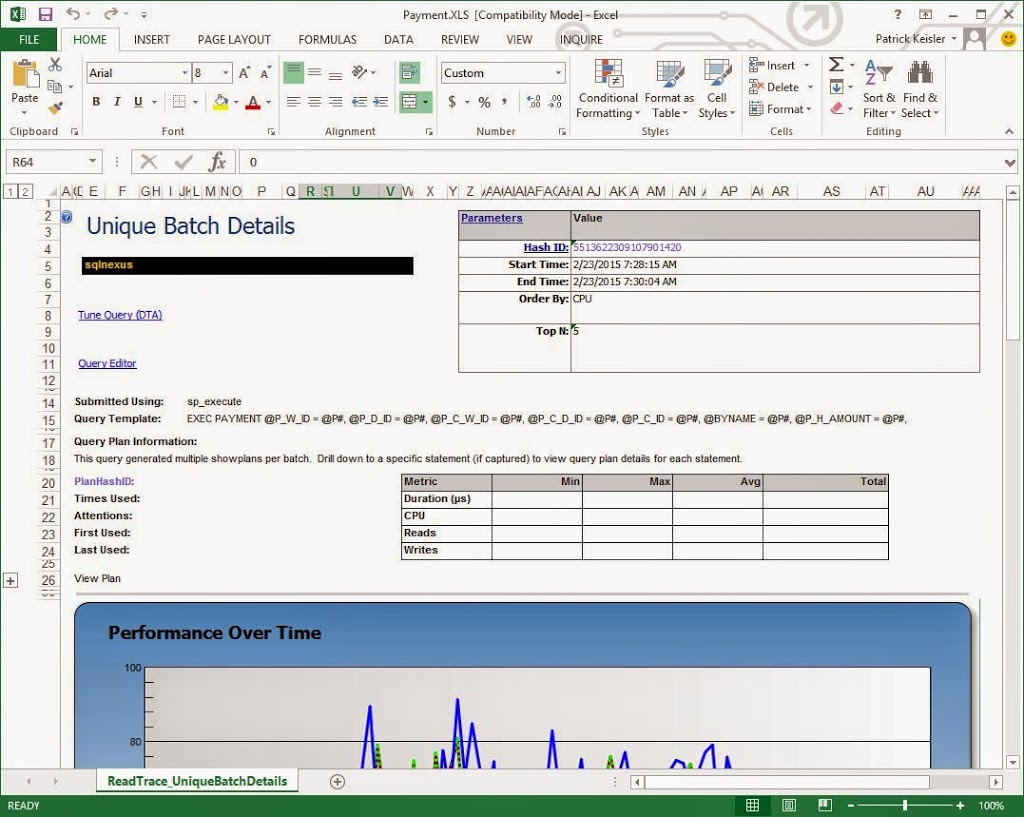
Finally, you can export the reports to an Excel file by clicking the Save button on the toolbar.
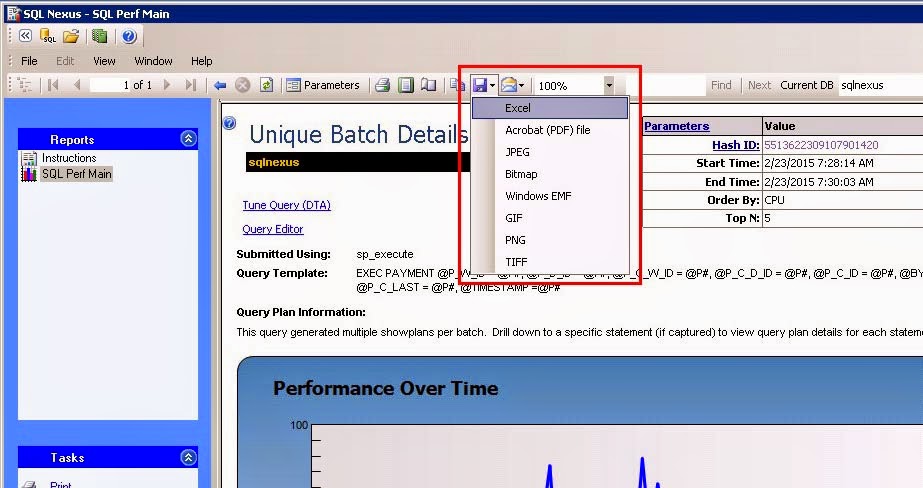
For example, through your analysis you find the offending query; you can export the batch details report to an Excel file and share that report with the development team or other DBA team members.
Conclusion
As you can see, SQL Nexus can be a very powerful tool to help troubleshoot performance issues within SQL Server. This is why the tool is widely used internally be various SQL Server support teams. The best way for you to get more info is to practice collecting and analyzing data from your servers. However, be sure that you practice on a TEST server and not in your production environment. Soon you’ll be able to quickly diagnose and resolve performance issues in your environment. And one day, it might just save your bacon!