
With opening day of Major League Baseball season finally here, I thought I’d take the time to cover two of my favorite topics…SQL Server and softball. Have you ever thought about how you can use SQL Server in conjunction with softball? Ok, so maybe you haven’t, but I have. I have been managing a slow-pitch softball team, the Sons of Pitches, for the past 5 years. Yes, I did say “slow-pitch”. My friends and I have already passed the peak of our physical ability, so we use it as an excuse to get together and have a little fun.
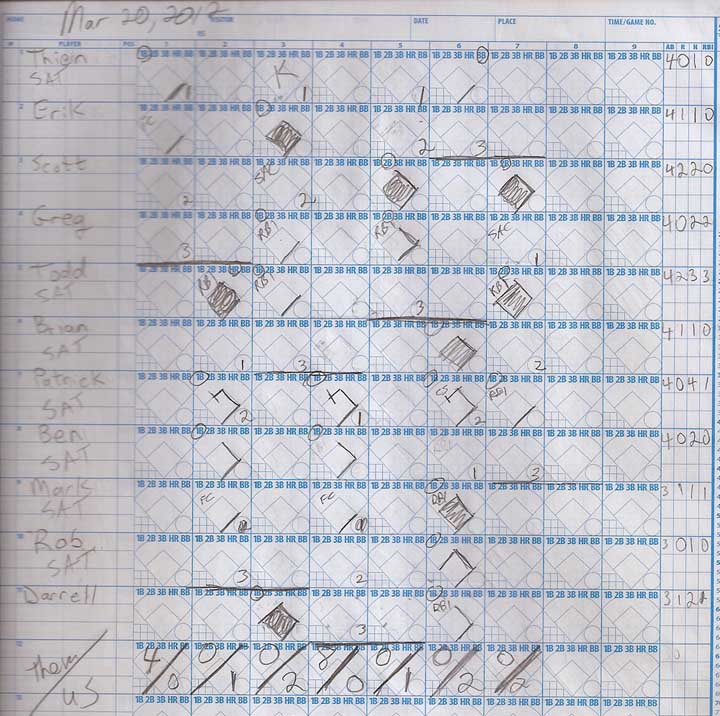
As a DBA, I’m big on keeping track of metrics, so naturally this spills over into my extracurricular activities. For each softball game, the league requires us to keep score, but in addition to that I like to keep individual player stats. Why would I want to do this? For benchmarking, of course! How will I ever tell if my players are getting better or worse without it? So to save myself a lot of time each week, I created a SQL Server database to keep track of all the stats. Each week, all I have to do is enter the stats and then generate a report by running a few TSQL scripts. Below is a sample of the score book that I keep for each game. This is the only manual piece. Everything else is automated by SQL Server.
Let’s start by creating our database and then a Games table to hold all of the data.
CREATE DATABASE Softball;
GO
USE Softball;
GO
CREATE TABLE dbo.Games(
    [Id] INT IDENTITY(1,1) NOT NULL,
    [GameDate] DATE DEFAULT(GETDATE()) NOT NULL,
    [SeasonId] INT NOT NULL,
    [SeasonName] VARCHAR(50) NOT NULL,
    [GameNumber] SMALLINTNOT NULL,
    [BattingOrder] SMALLINTNOT NULL,
    [Roster] SMALLINT NOT NULL,
    [Name] VARCHAR(50) NOT NULL,
    [PA] FLOAT NOT NULL,
    [AB]  AS ([PA]-([SACf]+[BB])),
    [H]  AS ((([1B]+[2B])+[3B])+[HR]),
    [1B] FLOAT NOT NULL,
    [2B] FLOAT NOT NULL,
    [3B] FLOAT NOT NULL,
    [HR] FLOAT NOT NULL,
    [ROE] FLOAT NOT NULL,
    [SACf] FLOAT NOT NULL,
    [BB] FLOAT NOT NULL,
    [K] FLOAT NOT NULL,
    [RBI] FLOAT NOT NULL,
    [RUNS] FLOAT NOT NULL
);
GO
ALTER TABLE dbo.Games
    ADD CONSTRAINT PK_Games PRIMARY KEY CLUSTERED (Id,GameDate);
GO
Let’s backup for one minute. For those of you who are not familiar with baseball (or softball) scoring; here’s a quick break down of what each abbreviation means. These are the definitions for my softball scoring. Some baseball statistics are omitted, because they are not relevant in our league.
- PA = Plate Appearance: number of times that player appeared in the batter’s box.
- AB = At Bat: plate appearances, not including walks or sacrifices.
- H = Hit: number of times a batter safely reached a base w/o an error by the defense.
- 1B = Single: number of times a batter safely reached first base w/o an error by the defense.
- 2B = Double: number of times a batter safely reached second base w/o an error by the defense.
- 3B = Triple: number of times a batter safely reached third base w/o an error by the defense.
- HR = Home Run: number of times a batter safely reached all four bases w/o an error by the defense.
- ROE = Reached on Error: number of times a batter safely reached a base with an error by the defense.
- SACf = Sacrifice Fly: Fly ball hit the outfield that was caught for an out, but allowed a base runner to advance.
- BB = Base on Balls (aka Walk): number of times a batter did not swing at four pitches outside the strike zone, and was awarded first base by the umpire.
- K = Strike Out: number of times a third strike is called or swung at and missed, or hit foul when the batter already had two strikes.
- RBI = Run Batted In: number of runners who scored as a result of the batters’ action.
- RUNS = Runs Scored: number of times a runner crossed home plate.
- BA = Batting Average: Hits (H) divided by At Bats (AB).
- OB = On Base Percentage: number of times a batter reached base (H + AB) divided by (AB + BB + SACf).
- SLUG = Slugging Average: number of bases achieved (1B+2B*2+3B*3+HR*4) divided by At Bats (AB). One base is for each 1B, two bases for each 2B, three bases for each 3B, and four bases for each HR.
- OPS = On Base Percentage Plus Slugging: sum of batter’s OB + SLUG.
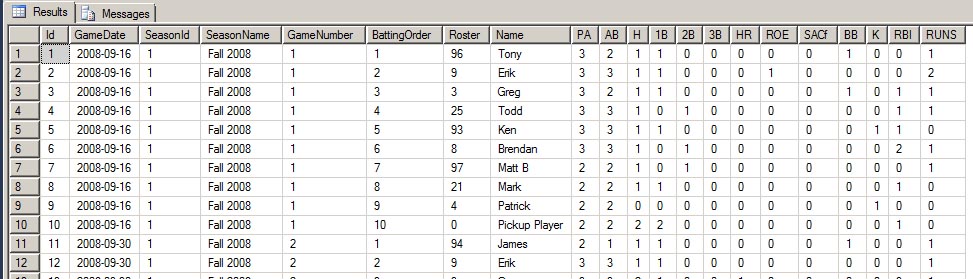
The Games table will hold one row for each player and his stats for that game. All columns will need to be manually entered, except for H and AB. The hits and at bats are two of the various computed columns. What we have now is the raw data stored in the database.
SELECT * FROM Games;
GO
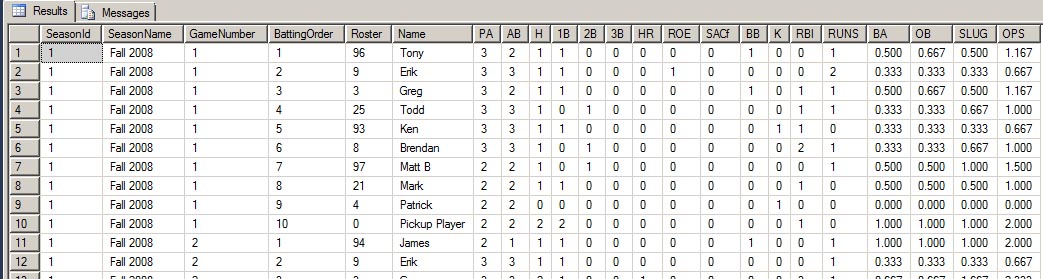
Next, need to build some views to add the other calculated fields: BA, OB, SLUG, and OPS, as well as present the data in a more readable format. Since Hits (H) and At Bats (AB) are already computed columns, we need to use a view in order to use them in another computed column.
CREATE VIEW dbo.PlayerStats
AS
SELECT
     [SeasonId]
    ,[SeasonName]
    ,[GameNumber]
    ,[BattingOrder]
    ,[Roster]
    ,[Name]
    ,[PA]
    ,[AB]
    ,[H]
    ,[1B]
    ,[2B]
    ,[3B]
    ,[HR]
    ,[ROE]
    ,[SACf]
    ,[BB]
    ,[K]
    ,[RBI]
    ,[RUNS]
    ,CONVERT(DECIMAL(5,3),(ISNULL(([H]/NULLIF([AB],0)),0))) AS [BA]
    ,CONVERT(DECIMAL(5,3),(ISNULL((([H]+[BB])/(NULLIF([AB]+[BB]+[SACf],0))),0))) AS [OB]
    ,CONVERT(DECIMAL(5,3),(ISNULL((([1B]+([2B]*2)
        +([3B]*3)+([HR]*4))/NULLIF([AB],0)),0))) AS [SLUG]
    ,CONVERT(DECIMAL(5,3),(ISNULL((([H]+[BB])/NULLIF([AB]+[BB]+[SACf],0)),0)
        +ISNULL((([1B]+([2B]*2)+([3B]*3)+([HR]*4))/NULLIF([AB],0)),0))) AS [OPS]
FROM dbo.Games;
GO
SELECT * FROM PlayerStats;
GO
Next, we can create a view for the season stats.
CREATE VIEW dbo.SeasonStats
AS
SELECT
     [SeasonId]
    ,[SeasonName]
    ,[Roster]
    ,[Name]
    ,COUNT(GameNumber) as [Games]
    ,SUM([PA]) AS [PA]
    ,SUM([AB]) AS [AB]
    ,SUM([H]) AS [H]
    ,SUM([1B]) AS [1B]
    ,SUM([2B]) AS [2B]
    ,SUM([3B]) AS [3B]
    ,SUM([HR]) AS [HR]
    ,SUM([ROE]) AS [ROE]
    ,SUM([SACf]) AS [SACf]
    ,SUM([BB]) AS [BB]
    ,SUM([K]) AS [K]
    ,SUM([RBI]) AS [RBI]
    ,SUM([RUNS]) AS [RUNS]
    ,ISNULL(CONVERT(DECIMAL(5,3),(SUM([H])/NULLIF(SUM([AB]),0))),0) AS [BA]
    ,ISNULL(CONVERT(DECIMAL(5,3),((SUM([H])+SUM([BB]))
        /(NULLIF(SUM([AB])+SUM([BB])+SUM([SACf]),0)))),0) AS [OB]
    ,ISNULL(CONVERT(DECIMAL(5,3),((SUM([1B])+(SUM([2B])*2)
        +(SUM([3B])*3)+(SUM([HR])*4))/NULLIF(SUM([AB]),0))),0) AS [SLUG]
    ,CONVERT(DECIMAL(5,3),ISNULL((SUM([H])+SUM([BB]))
        /(NULLIF(SUM([AB])+SUM([BB])+SUM([SACf]),0)),0)+ISNULL((SUM([1B])
        +(SUM([2B])*2)+(SUM([3B])*3)+(SUM([HR])*4))/NULLIF(SUM([AB]),0),0)) AS [OPS]
FROM dbo.PlayerStats
GROUP BY [SeasonId],[SeasonName],[Roster],[Name];
GO
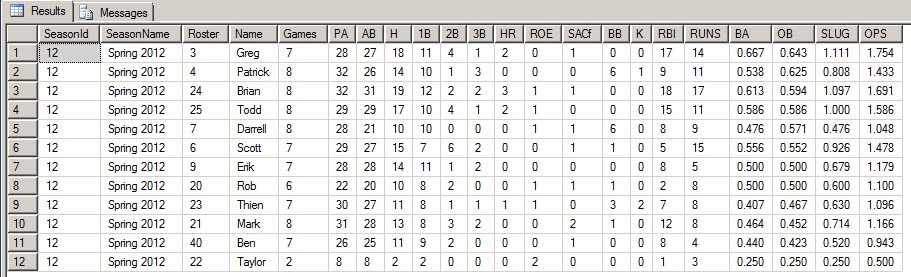
This will allow us to view each player’s stats for a given season.
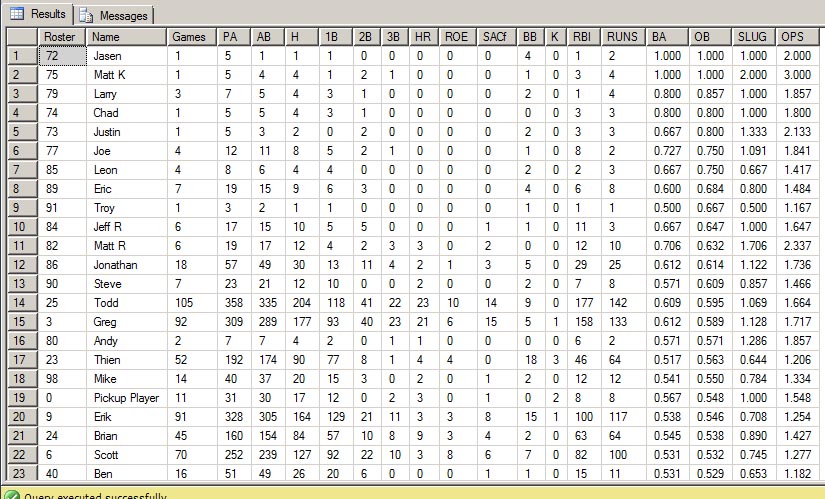
SELECT * FROM SeasonStats
WHERE SeasonId = 12
ORDER BY [OB] DESC, [BA] DESC;
GO
In addition to season stats, we also need a view for career stats.
CREATE VIEW dbo.CareerStats
AS
SELECT
     [Roster]
    ,[Name]
    ,COUNT(GameNumber) as [Games]
    ,SUM([PA]) AS [PA]
    ,SUM([AB]) AS [AB]
    ,SUM([H]) AS [H]
    ,SUM([1B]) AS [1B]
    ,SUM([2B]) AS [2B]
    ,SUM([3B]) AS [3B]
    ,SUM([HR]) AS [HR]
    ,SUM([ROE]) AS [ROE]
    ,SUM([SACf]) AS [SACf]
    ,SUM([BB]) AS [BB]
    ,SUM([K]) AS [K]
    ,SUM([RBI]) AS [RBI]
    ,SUM([RUNS]) AS [RUNS]
    ,ISNULL(CONVERT(DECIMAL(5,3),(SUM([H])/NULLIF(SUM([AB]),0))),0) AS [BA]
    ,ISNULL(CONVERT(DECIMAL(5,3),((SUM([H])+SUM([BB]))
        /(NULLIF(SUM([AB])+SUM([BB])+SUM([SACf]),0)))),0) AS [OB]
    ,ISNULL(CONVERT(DECIMAL(5,3),((SUM([1B])+(SUM([2B])*2)
        +(SUM([3B])*3)+(SUM([HR])*4))/NULLIF(SUM([AB]),0))),0) AS [SLUG]
    ,CONVERT(DECIMAL(5,3),ISNULL((SUM([H])+SUM([BB]))
        /(NULLIF(SUM([AB])+SUM([BB])+SUM([SACf]),0)),0)+ISNULL((SUM([1B])
        +(SUM([2B])*2)+(SUM([3B])*3)+(SUM([HR])*4))/NULLIF(SUM([AB]),0),0)) AS [OPS]
FROM dbo.PlayerStats
GROUP BY [Roster],[Name];
GO
SELECT * FROM CareerStats
ORDER BY [OB] DESC, [BA] DESC;
GO
Next, we can create a view for the individual player stats.
CREATE VIEW dbo.IndividualStats
AS
SELECT
     CONVERT(VARCHAR,[SeasonId]) AS [SeasonId]
    ,[SeasonName]
    ,[Roster]
    ,[Name]
    ,COUNT(GameNumber) AS [Games]
    ,SUM([PA]) AS [PA]
    ,SUM([AB]) AS [AB]
    ,SUM([H]) AS [H]
    ,SUM([1B]) AS [1B]
    ,SUM([2B]) AS [2B]
    ,SUM([3B]) AS [3B]
    ,SUM([HR]) AS [HR]
    ,SUM([ROE]) AS [ROE]
    ,SUM([SACf]) AS [SACf]
    ,SUM([BB]) AS [BB]
    ,SUM([K]) AS [K]
    ,SUM([RBI]) AS [RBI]
    ,SUM([RUNS]) AS [RUNS]
    ,ISNULL(CONVERT(DECIMAL(5,3),(SUM([H])/NULLIF(SUM([AB]),0))),0) AS [BA]
    ,ISNULL(CONVERT(DECIMAL(5,3),((SUM([H])+SUM([BB]))
        /(NULLIF(SUM([AB])+SUM([BB])+SUM([SACf]),0)))),0) AS [OB]
    ,ISNULL(CONVERT(DECIMAL(5,3),((SUM([1B])+(SUM([2B])*2)
        +(SUM([3B])*3)+(SUM([HR])*4))/NULLIF(SUM([AB]),0))),0) AS [SLUG]
    ,CONVERT(DECIMAL(5,3),ISNULL((SUM([H])+SUM([BB]))
        /(NULLIF(SUM([AB])+SUM([BB])+SUM([SACf]),0)),0)+ISNULL((SUM([1B])
        +(SUM([2B])*2)+(SUM([3B])*3)+(SUM([HR])*4))/NULLIF(SUM([AB]),0),0)) AS [OPS]
FROM dbo.PlayerStats
GROUP BY [SeasonId],[SeasonName],[Roster],[Name];
GO
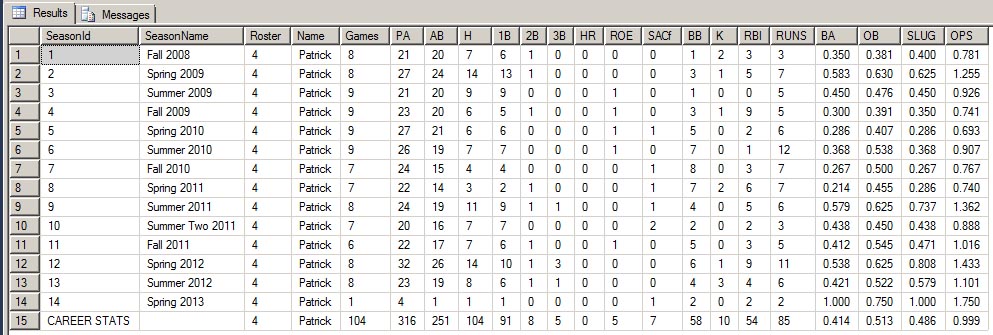
This will allow us to view the stats from an individual player as well as union all of the careers stats.
SELECT * FROM IndividualStats
WHERE Roster = 4
UNION ALL
SELECT ‘CAREER STATS’,”,* FROM CareerStats
WHERE Roster = 4;
GO
Finally, we can create one last view for the individual player stats by season.
CREATE VIEW dbo.IndividualTeamStats
AS
SELECT
     CONVERT(varchar,[SeasonId]) AS [SeasonId]
    ,[SeasonName]
    ,[Roster]
    ,[Name]
    ,CONVERT(varchar,[GameNumber]) AS [Games]
    ,SUM([PA]) AS [PA]
    ,SUM([AB]) AS [AB]
    ,SUM([H]) AS [H]
    ,SUM([1B]) AS [1B]
    ,SUM([2B]) AS [2B]
    ,SUM([3B]) AS [3B]
    ,SUM([HR]) AS [HR]
    ,SUM([ROE]) AS [ROE]
    ,SUM([SACf]) AS [SACf]
    ,SUM([BB]) AS [BB]
    ,SUM([K]) AS [K]
    ,SUM([RBI]) AS [RBI]
    ,SUM([RUNS]) AS [RUNS]
    ,ISNULL(CONVERT(DECIMAL(5,3),(SUM([H])/NULLIF(SUM([AB]),0))),0) AS [BA]
    ,ISNULL(CONVERT(DECIMAL(5,3),((SUM([H])+SUM([BB]))
        /(NULLIF(SUM([AB])+SUM([BB])+SUM([SACf]),0)))),0) AS [OB]
    ,ISNULL(CONVERT(DECIMAL(5,3),((SUM([1B])+(SUM([2B])*2)
        +(SUM([3B])*3)+(SUM([HR])*4))/NULLIF(SUM([AB]),0))),0) AS [SLUG]
    ,CONVERT(DECIMAL(5,3),ISNULL((SUM([H])+SUM([BB]))
        /(NULLIF(SUM([AB])+SUM([BB])+SUM([SACf]),0)),0)+ISNULL((SUM([1B])
        +(SUM([2B])*2)+(SUM([3B])*3)+(SUM([HR])*4))/NULLIF(SUM([AB]),0),0)) AS [OPS]
FROM dbo.Games
GROUP BY [SeasonId],[SeasonName],[Name],[Roster],[GameNumber]
UNION
SELECT
     ‘SEASON STATS’
    ,[SeasonName]
    ,[Roster]
    ,[Name]
    ,”
    ,[PA]
    ,[AB]
    ,[H]
    ,[1B]
    ,[2B]
    ,[3B]
    ,[HR]
    ,[ROE]
    ,[SACf]
    ,[BB]
    ,[K]
    ,[RBI]
    ,[RUNS]
    ,[BA]
    ,[OB]
    ,[SLUG]
    ,[OPS]
FROM dbo.SeasonStats;
GO
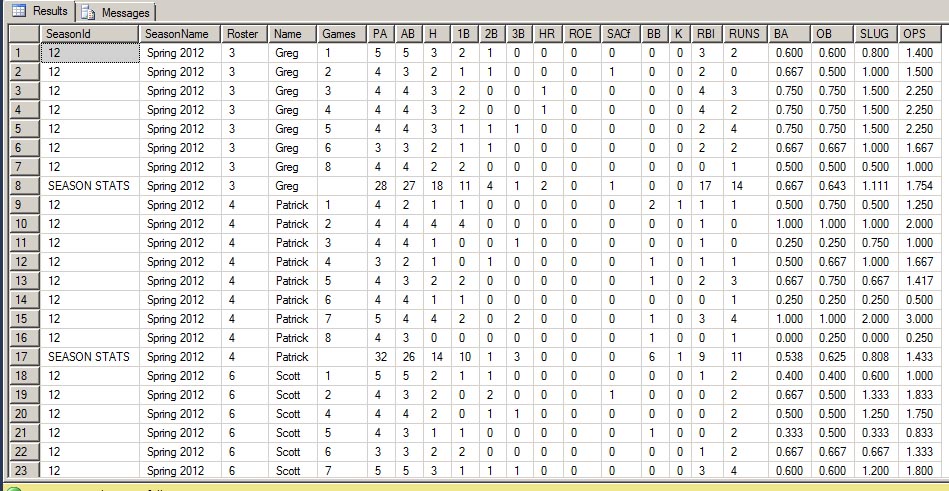
This allows us to get a line by line view of what each player did in each game throughout the season as well as have his aggregated season stats.
SELECT * FROM IndividualStatsTeam
WHERE SeasonName = ‘Spring 2012’
ORDER BY Roster;
GO
As you can see, two of the things I’m passionate about, SQL Server and softball, work very well together. Although this was done as a hobby, I use it every single week. What kind of hobbies can you use SQL Server for?And yes, these are the actual stats of my team. We play just about every Tuesday night during the spring, summer, and fall for the SportsLink league in Charlotte, NC. We’re not the best team, but we’re also nowhere near the worst, and we’ve managed to win the league championship twice. If you happen to be in Charlotte for the SQLPass Summit in October, maybe you can find some time of come watch my team play that Tuesday night. I can’t guarantee that it will be good or bad, but it’s definitely entertaining.