
In a previous post, Collecting Historical Wait Statistics, I discussed how you can easily collect historical wait stats by using the DMV sys.dm_os_wait_stats. Well today, I’d like to cover the same concept, but this time collect historical IO file stats from the DMV, sys.dm_io_virtual_files_stats. However, I wanted to improve on the code to make it even easier to implement.
The data collection process is still implemented the same way. First, we’ll need to create a history table to store the data. The data is stored in time slices with the cumulative values as well as the difference (TimeDiff_ms, NumOfReadsDiff, NumOfWritesDiff, etc) in those values since the last collection time.
CREATE TABLE dbo.IoVirtualFileStatsHistory(
SqlServerStartTime DATETIME NOT NULL
,CollectionTime DATETIME NOT NULL
,TimeDiff_ms BIGINT NOT NULL
,DatabaseName NVARCHAR(128) NOT NULL
,DatabaseId SMALLINT NOT NULL
,FileId SMALLINT NOT NULL
,SampleMs INT NOT NULL
,SampleMsDiff INT NOT NULL
,NumOfReads BIGINT NOT NULL
,NumOfReadsDiff BIGINT NOT NULL
,NumOfBytesRead BIGINT NOT NULL
,NumOfBytesReadDiff BIGINT NOT NULL
,IoStallReadMs BIGINT NOT NULL
,IoStallReadMsDiff BIGINT NOT NULL
,NumOfWrites BIGINT NOT NULL
,NumOfWritesDiff BIGINT NOT NULL
,NumOfBytesWritten BIGINT NOT NULL
,NumOfBytesWrittenDiff BIGINT NOT NULL
,IoStallWriteMs BIGINT NOT NULL
,IoStallWriteMsDiff BIGINT NOT NULL
,IoStall BIGINT NOT NULL
,IoStallDiff BIGINT NOT NULL
,SizeOnDiskBytes BIGINT NOT NULL
,SizeOnDiskBytesDiff BIGINT NOT NULL
,FileHandle VARBINARY(8) NOT NULL
,CONSTRAINT PK_IoVirtualFileStatsHistory PRIMARY KEY CLUSTERED
(CollectionTime,DatabaseName,DatabaseId,FileId)
)WITH (DATA_COMPRESSION = PAGE);
GO
The next step will be to get the start time of SQL Server, so that we can compare it to the previous collection. If the dates are different, then we must take that into account when calculating the diff values. Because if SQL Server is restarted, then all values in the DMV are reset back to zero. At this point, we know the diff values are actually the same value as the current counters, because this is the first collection after a restart.
IF @CurrentSqlServerStartTime <> ISNULL(@PreviousSqlServerStartTime,0)
BEGIN
-- If SQL started since the last collection, then insert starter values
-- Must do DATEDIFF using seconds instead of milliseconds to avoid arithmetic overflow.
INSERT INTO dbo.IoVirtualFileStatsHistory
SELECT
@CurrentSqlServerStartTime
,CURRENT_TIMESTAMP
,CONVERT(BIGINT,DATEDIFF(SS,@CurrentSqlServerStartTime,CURRENT_TIMESTAMP))*1000
,@DatabaseName
,@DatabaseId
,file_id
,sample_ms
,sample_ms
,num_of_reads
,num_of_reads
,num_of_bytes_read
,num_of_bytes_read
,io_stall_read_ms
,io_stall_read_ms
,num_of_writes
,num_of_writes
,num_of_bytes_written
,num_of_bytes_written
,io_stall_write_ms
,io_stall_write_ms
,io_stall
,io_stall
,size_on_disk_bytes
,size_on_disk_bytes
,file_handle
FROM sys.dm_io_virtual_file_stats(@DatabaseId,NULL);
END
GO
You may notice the DATEDIFF is using “seconds” instead of “milliseconds”. This is because DATEDIFF only returns an INT value. The largest number it can return is equal to about 24 days before it hits an arithmetic overflow error. By converting it to seconds, we can avoid that error. All of the following data collections will do a DATEDIFF using milliseconds.
If the current start time is the same as the previous collection, then we’ll grab the difference in values and insert those into the history table.
WITH CurrentIoVirtualFileStats AS
(
SELECT
CURRENT_TIMESTAMP AS 'CollectionTime'
,@DatabaseName AS 'DatabaseName'
,*
FROM sys.dm_io_virtual_file_stats(@DatabaseId,NULL)
)
INSERT INTO dbo.IoVirtualFileStatsHistory
SELECT
@CurrentSqlServerStartTime
,CURRENT_TIMESTAMP
,CONVERT(BIGINT,DATEDIFF(MS,@PreviousCollectionTime,curr.CollectionTime))
,@DatabaseName
,@DatabaseId
,file_id
,sample_ms
,curr.sample_ms - hist.SampleMs
,num_of_reads
,curr.num_of_reads - hist.NumOfReads
,num_of_bytes_read
,curr.num_of_bytes_read - hist.NumOfBytesRead
,io_stall_read_ms
,curr.io_stall_read_ms - hist.IoStallReadMs
,num_of_writes
,curr.num_of_writes - hist.NumOfWrites
,num_of_bytes_written
,curr.num_of_bytes_written - hist.NumOfBytesWritten
,io_stall_write_ms
,curr.io_stall_write_ms - hist.IoStallWriteMs
,io_stall
,curr.io_stall - hist.IoStall
,size_on_disk_bytes
,curr.size_on_disk_bytes - hist.SizeOnDiskBytes
,file_handle
FROM CurrentIoVirtualFileStats curr INNER JOIN dbo.IoVirtualFileStatsHistory hist
ON (curr.DatabaseName = hist.DatabaseName
AND curr.database_id = hist.DatabaseId
AND curr.file_id = hist.FileId)
AND hist.CollectionTime = @PreviousCollectionTime;
GO
At this point, we’re through collecting the raw data. However, as I mentioned earlier, I added a lot of functionality into this script. The script is actually a stored procedure that can run all of this code for you; including creation of the history table, data collection, historical data purging and finally reporting.
The stored procedure has 5 input parameters.
@Database – This is used to specify a single database, a list of databases, or a wildcard.
- ‘*’ is the default value which selects all databases
- ‘MyDatabase1’ will process only that single database
- ‘MyDatabase1,MyDatabase2,MyDatabase3’ Comma delimited list of databases
- ‘USER_DATABASES’ used to process all user databases
- ‘SYSTEM_DATABASES’ used to process only the system databases.
@GenerateReport – Flag. When off, the stored procedure will collect data. When on, it will generate an aggregated report of the historical data.
@HistoryRetention – The is the number of days to keep in the history table. Default is 365.
@ExcludedDBs – Is a comma delimited list of databases to exclude from processing. It should be used when @Database is set to ‘*’.
@Debug – Flag. When on, it will output TSQL commands that being executed.
Examples:
1. Collect data for all databases.
EXEC dbo.sp_CollectIoVirtualFileStats
@Database = '*';
GO
2. Collect data for all databases except for AdventureWorks, and output all debug commands.
EXEC dbo.sp_CollectIoVirtualFileStats
@Database = '*'
,@ExcludedDBs = 'AdventureWorks'
,@Debug = 1;
GO
3. Output an aggregated report of data collected so far for tempdb.
EXEC dbo.sp_CollectIoVirtualFileStats
@Database = 'tempdb'
,@GenerateReport = 1;
GO
The report would look like this.
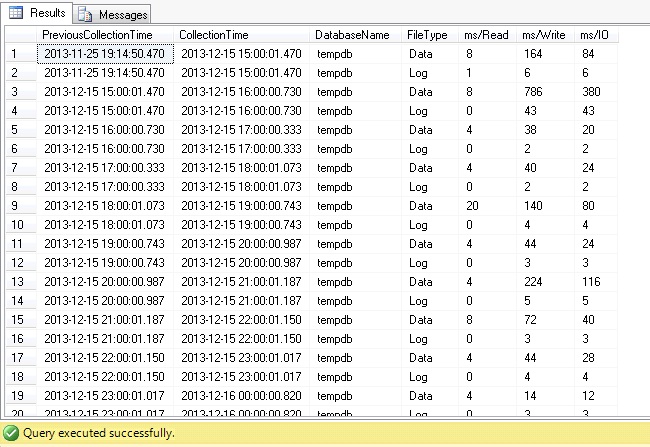
Finally, you can copy this report data into Excel and generate some easy to read charts.
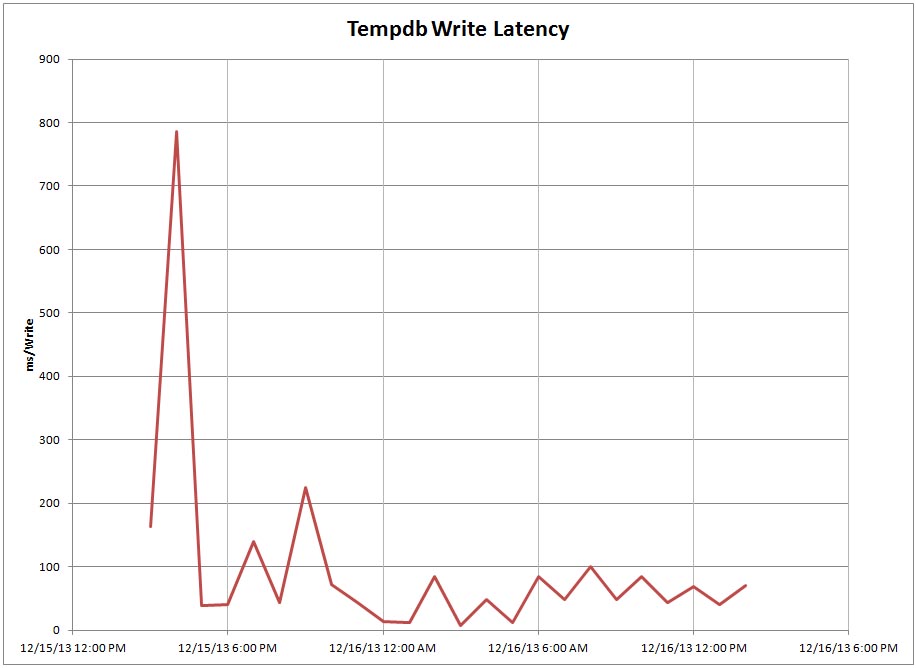
From the chart, we can see there was a spike in write latency between 3PM and 4PM for tempdb. If we collect this data over time and identify a similar spike each day then we’d want to investigate further to find out what is causing it. But that can only be done if you’re collecting these metrics and storing them for historical analysis. Hopefully, this stored procedure will help you be more proactive in collecting performance metrics for each of your servers.
The entire script is available on the resources page.


The entire script is available on the resources page. I cannot find the script. Could you please help, thnak you for your efforts
Click the Resources tab at the top or go direct to it.
https://www.patrickkeisler.com/resources/