Have you ever called Microsoft Customer Support for help with a SQL Server performance issue? The engineer will typically send you a self-extracting exe file with instructions to unzip the file on the server and run the pssdiag.cmd file to collect data while you reproduce your issue. Afterwards, you’re supposed to zip up the contents of the output folder and send it back to the engineer. How did the engineer compile that collection code so quickly? The answer is PSSDiag Configuration Manager, or simply DiagManager.
DiagManager is just a tool that you use to configure which performance items are to be collected by the SQLDIAG utility. The configuration files that come with SQLNexus (see my previous post) can be edited by hand, but sometimes it is much easier to use a GUI, and that’s where DiagManager can help you.
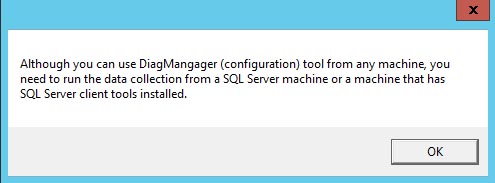
Version 12.0.0.1001 is the latest and to get it installed, just download it from codeplex and run SetupX86.msi. Go to the Start Menu and click on PSSDiag Configuration Manager to launch the program. Initially, you’ll get a warning screen to remind you the SQL client tools are required to run the collector. Just click OK to continue.
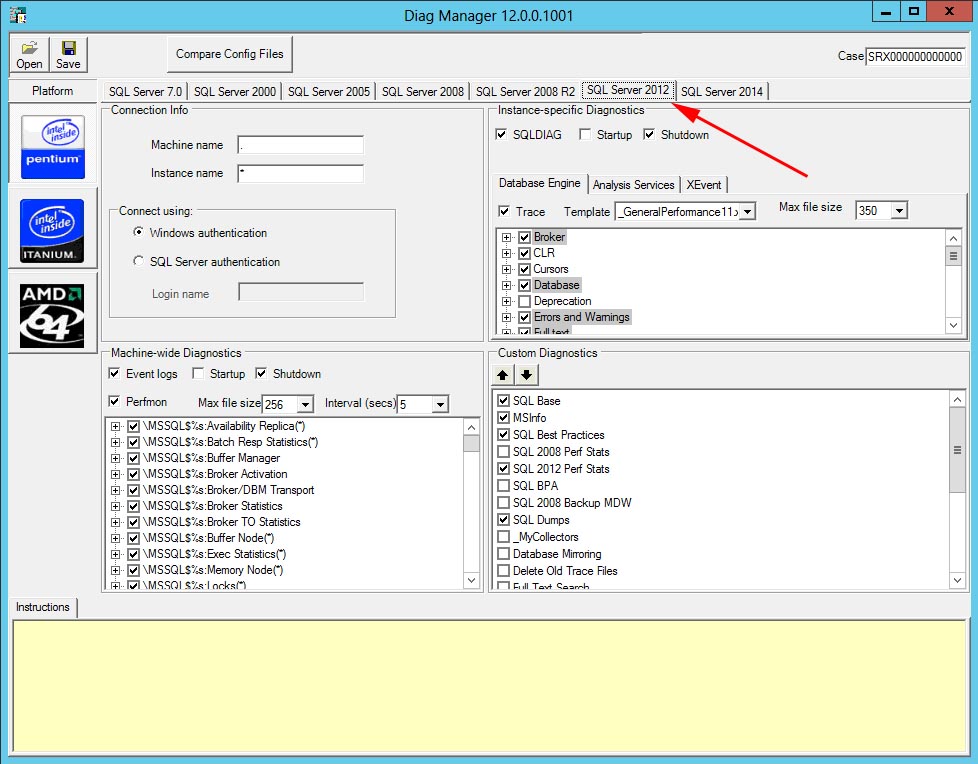
The first thing you’ll likely notice is a line of tabs across the top for different versions of SQL Server. Even though there are tabs for SQL Server 7.0 and 2000, they are no longer supported by this tool. If you really need a collection tool for those old version, then follow this link. But on the bright side, this latest version supports up to SQL Server 2014.
To get started using DiagManager, choose your version of SQL Server by selecting a tab.
Next, select the type of processor that your server has; for example, Intel or AMD. Itanium-based processors are no longer support for current versions of SQL Server. My server uses AMD processors, so I’ll need to click the AMD button.

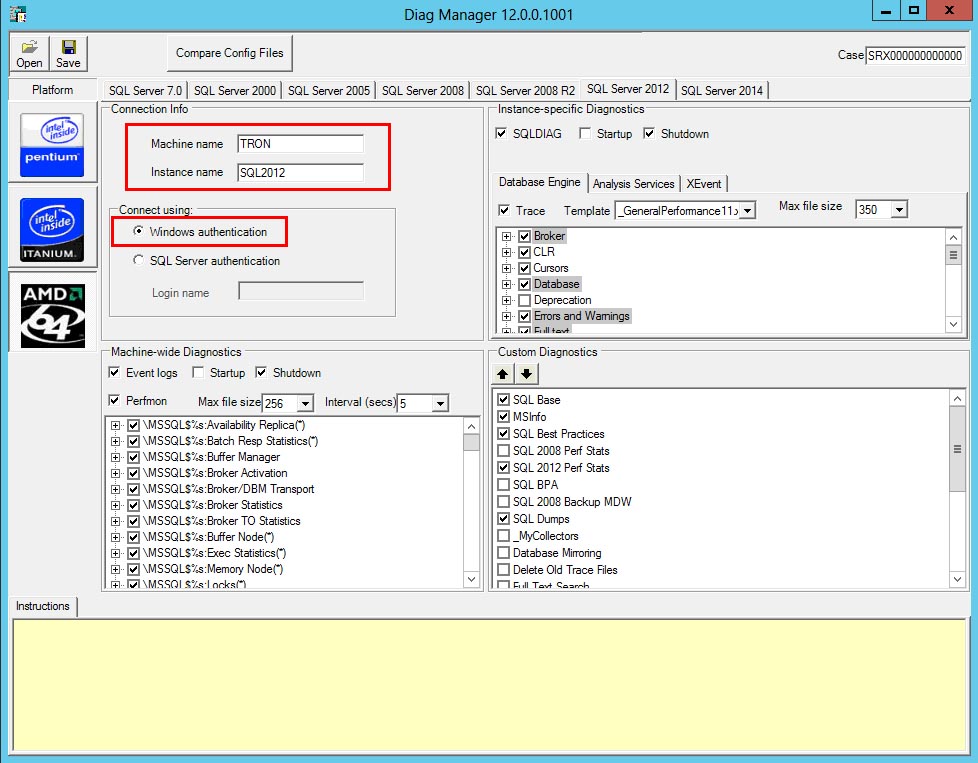
Now you will need to enter the Machine name and the Instance name that will be monitored. The default values “.” and “*” will capture data for all SQL Server instances on the local machine. Typically for troubleshooting you won’t need to capture data for all instances. If your SQL Server installation is running on a Windows Failover Cluster, then you need to enter the SQL Server Virtual Name and not the physical host name. You’ll also need to specify the credentials used to connect to SQL Server. In my example, I’ll be monitoring a stand-alone instance named TRONSQL2012 and connecting using Windows Authentication.
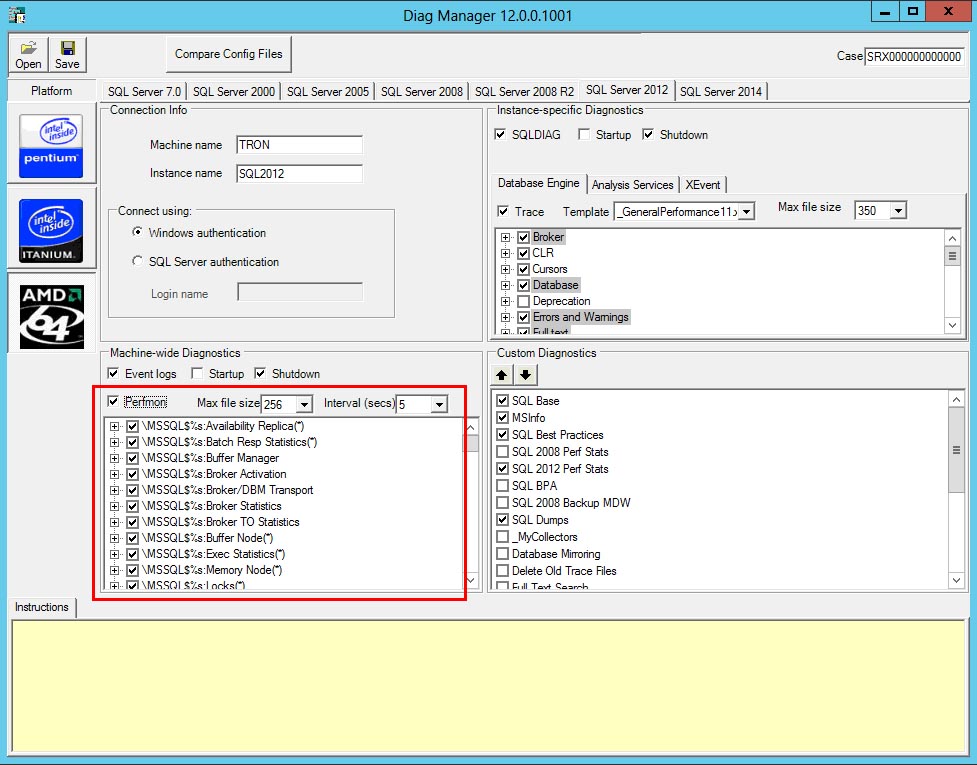
The section below that contains the Machine-wide Diagnostics are the counters you would normally see in Performance Monitor. All of the counters for SQL Server are checked by default as well as several for the Windows OS. At this point, you can add or remove counters that you want to capture. You can also specify the max file size (in MB) as well as the collection interval. The fault values are 256MB and 5 seconds.
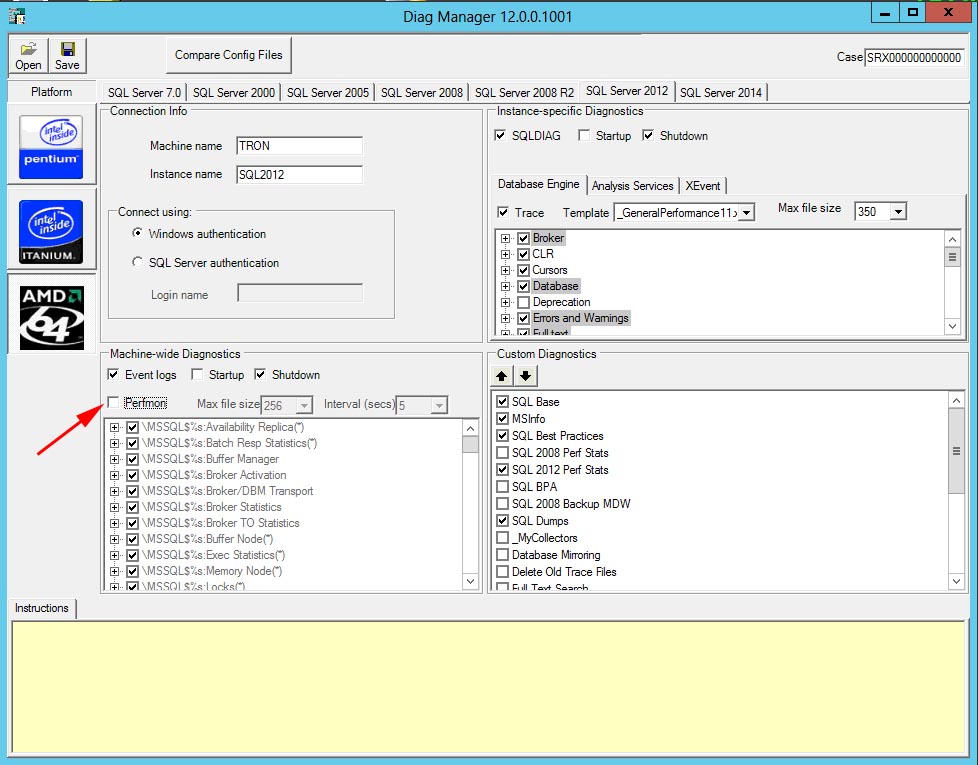
Unchecking the Perfmon box will disable the collection of all perfmon counters.
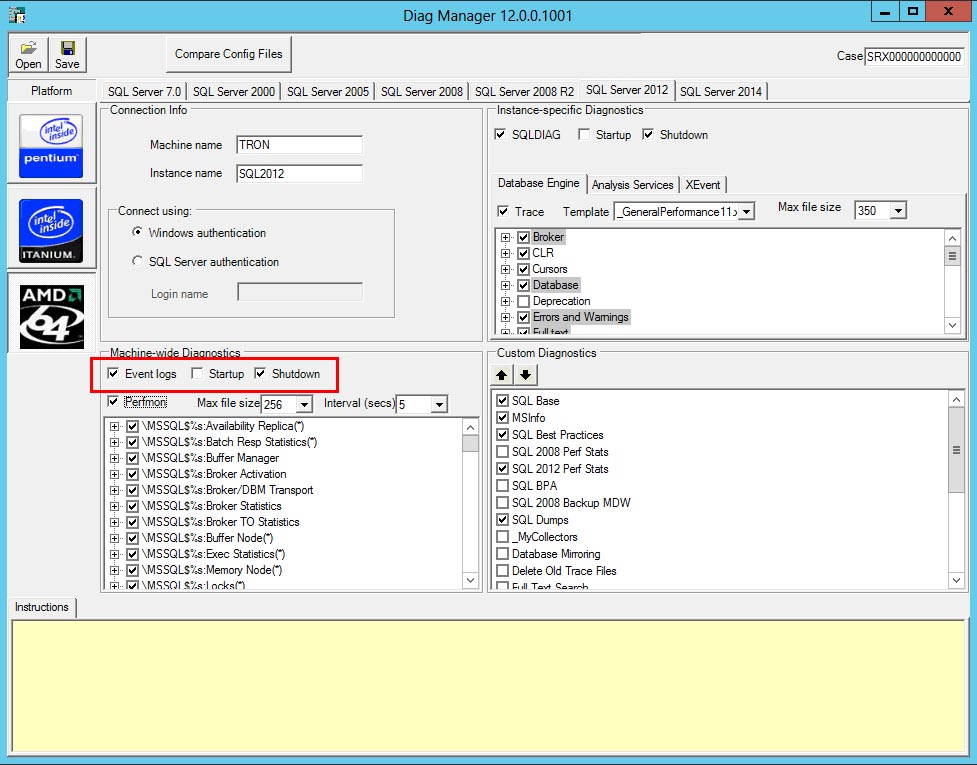
The three check boxes above the perfmon box are for the Windows Event Logs. By default, DiagManager will only grab the event logs when SQLDIAG is shutdown; however, you can check the Startup box and it will grab them at both startup and shutdown. This is helpful if you need to do a before after comparison of the Windows Event logs. The collected data will be saved in the output folder as comma-separated (CSV) files. Unchecking the Event Logs box will disable the collection of the event logs.
In the top right half of the window, you will see Instance-specific Diagnostics; aka SQLDIAG and SQL trace. By default, SQLDIAG will only collect its data at shutdown, but you can check the Startup box to get before and after collections. This works the same as the event log collection. If you want to see the TSQL code that is used to generate this output, then just open the MSDiagProcs.sql file in Management Studio. Unchecking the SQLDIAG box will disable the collection of the SQLDIAG data.
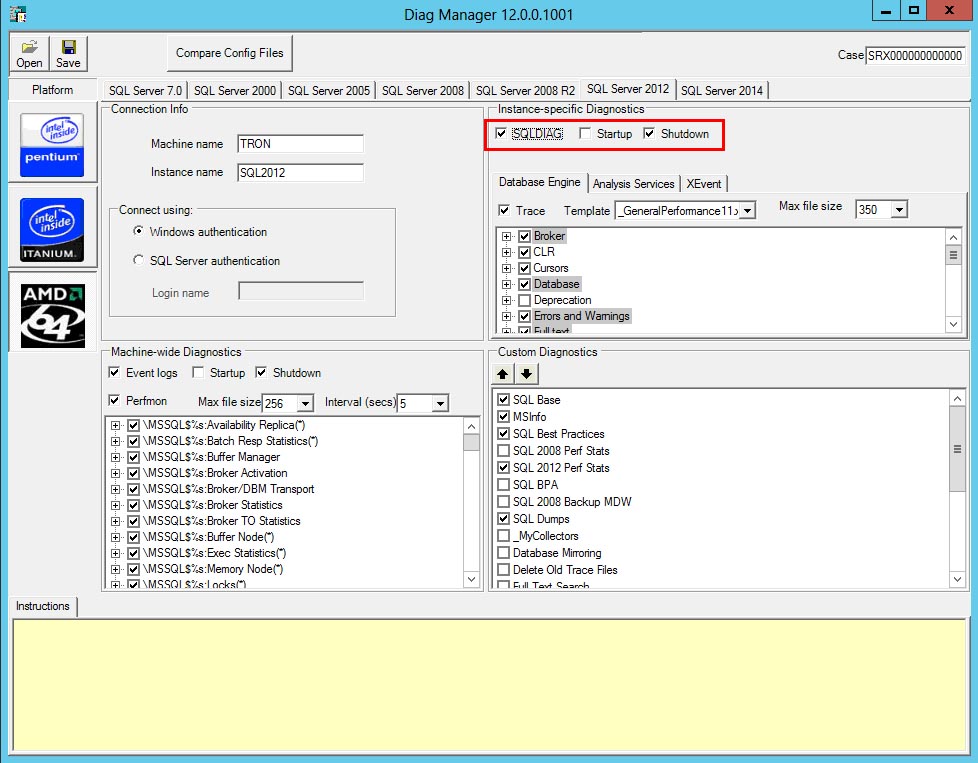
Below SQLDIAG, you will see three tabs: Database Engine, Analysis Services, and XEvent. The Analysis Services tab is disabled for the public version of DiagManager, and in the current version, the XEvent tab should not be used to collect database engine data. This leaves the Database Engine tab, which is controls the events that will be captured using a SQL Trace. If you have ever used SQL Profiler to create a trace, then you should be very familiar with these options. Simply browse through the list to check or uncheck the items you need to collect.
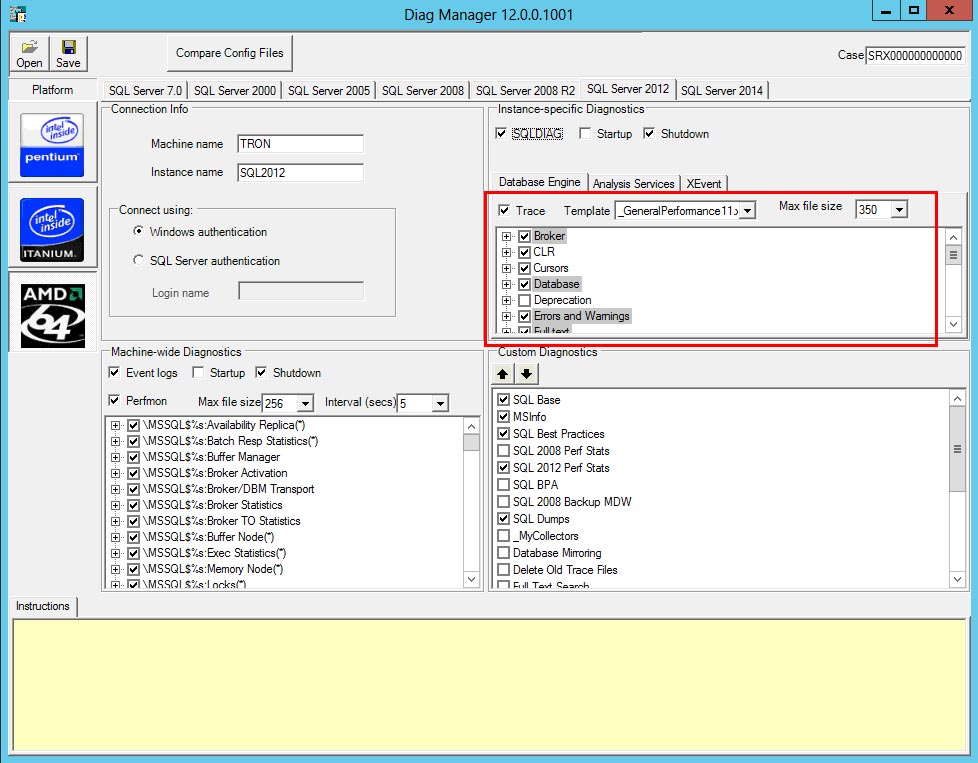
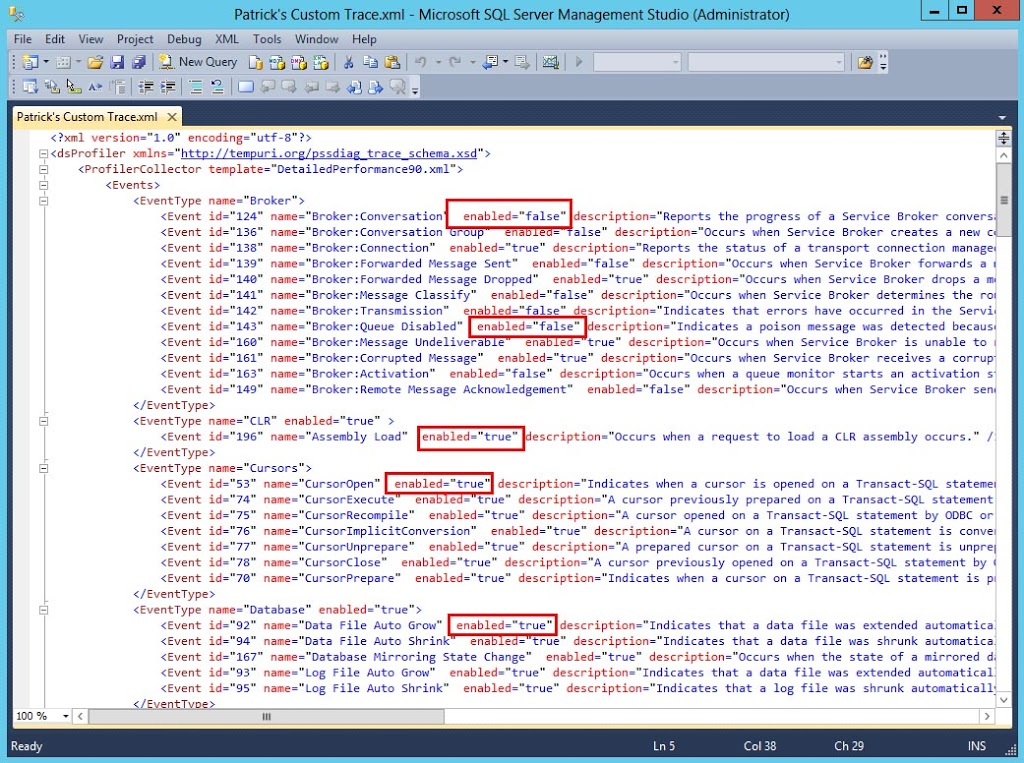
Above the list of trace events, you will see a Trace checkbox and two dropdown lists. Unchecking the Trace box will disable the collection of any trace data. The “Max file size” dropdown just controls how large the trace files will get before they rollover. The default is 350MB. The Template dropdown list is a way to quickly check/uncheck events that will be collected. There are three templates included: General Performance, Details Performance, and PSSReplay. The PSSReplay is similar to the replay template within Profiler. General vs Details events is basically batch-level events vs statement-level events. The coolest thing about the trace templates, is that you can create your own. To do so, navigate to the TraceTemplates folder in the DiagManager install folder (C:Program Files (x86)MicrosoftPssdiagTraceTemplates). Open the folder that matches your SQL version, and make a copy of one of the XML files. Open that cop in your favorite XML editor and just change the “enabled” value to “true” for the events to collect and “false” for the events you do not want to collect, and then save the XML file.
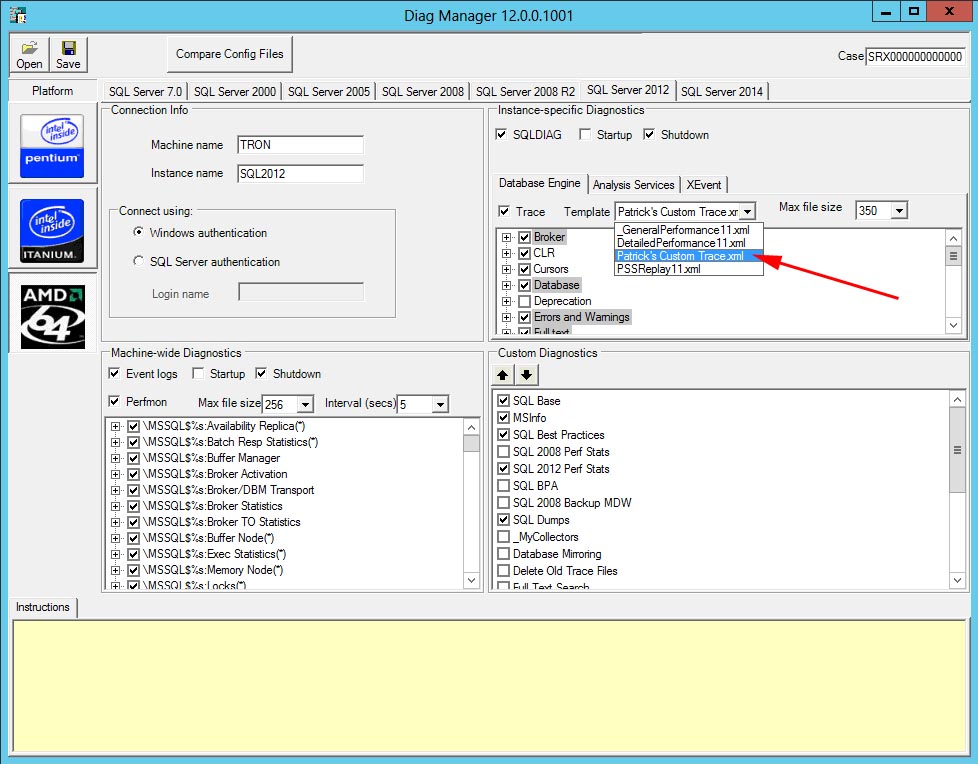
The next time you open up DiagManager you should see your custom template in the dropdown list.
One big word of caution; a SQL Trace will cause the HEAVIEST overhead to your SQL Server, so be careful what items you choose to capture. If you are worried about adding too much overhead to your SQL Server, then consider using the “XEvent Batch_RPC Only” option in the Custom Diagnostics section. Checking this option will create an Extended Events session that will only capture “rpc_completed” and “sql_batch_completed” events. An Extended Events sessions adds far less overhead than a SQL Trace, but DO NOT enable both the SQL Trace box and the XEvent Batch_RPC option. Doing so would run both a trace and xevent session and add a lot of overhead to your SQL Server.
For the other items in the Custom Diagnostics section, you can select each one to see a description of what they do in the Instructions window. For example, the SQL 2012 Perf Stats script will gather data from DMVs about various items such as: top N queries, missing indexes, statistics, and even Availability Group info.
The Custom Diagnostics section is exactly as it sounds. You can create your own TSQL scripts or other types of custom collectors. Navigate to the CustomDiagnostics folder in the DiagManager install folder (C:Program Files (x86)MicrosoftPssdiagCustomDiagnostics), and create a new folder a new folder for your custom code. In my example, I created a folder called “SQL Database List” and added three files to the folder.
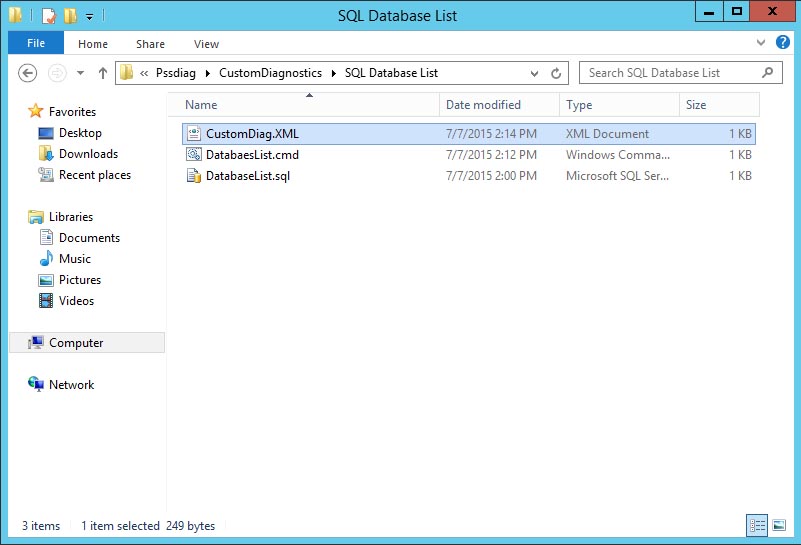
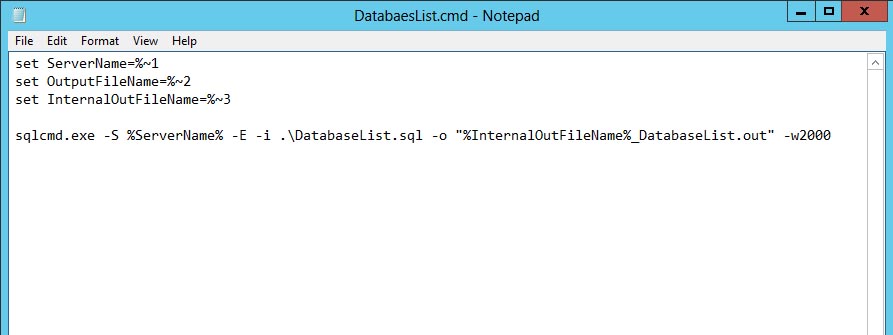
The first is just a TSQL script that has one command: “SELECT * FROM sys.databases;”. The DatabaseList.cmd is a Windows batch file that calls sqlcmd.exe and runs the DatabaseList.sql file.
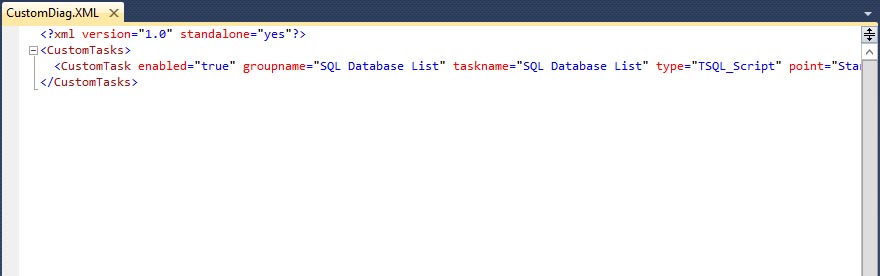
The CustomDiag.XML file was copied from another custom folder and edited to reference the TSQL file and define whether it runs at startup or shutdown.
Once you have your custom collector created, close and open DiagManager and you should see your custom collector in the Custom Diagnostics list.
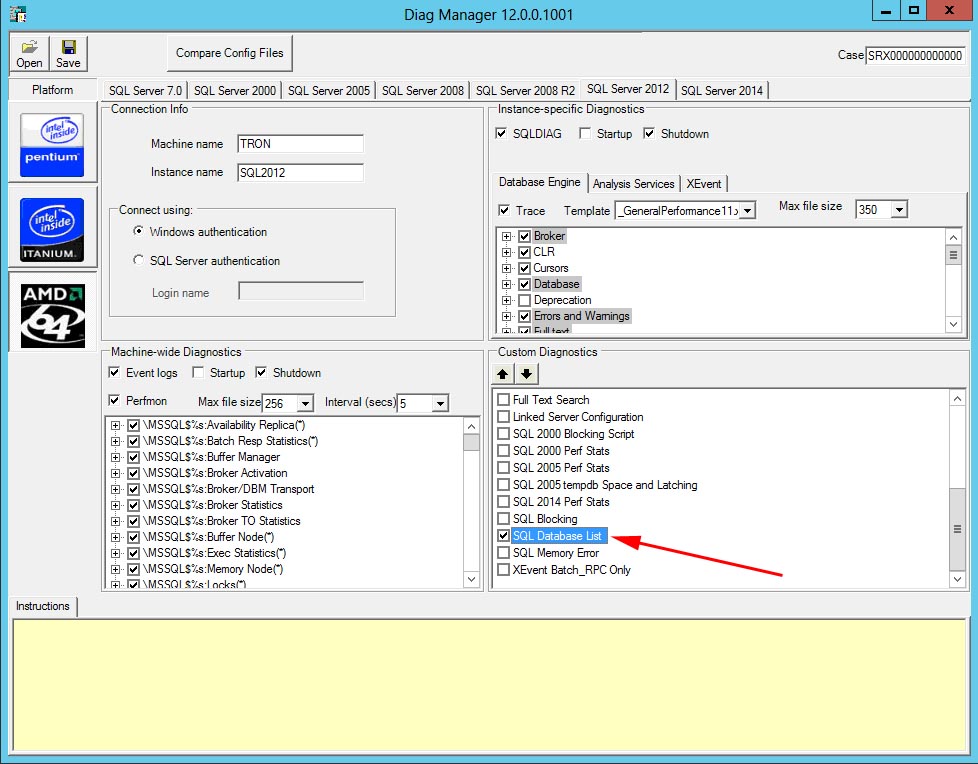
My example just captures a list of the databases, but you could easily create a script that captures data internal to one of your application databases.
Now that you have finally selected all the items that you want to collect, click the Save button at the top of the window. A Save Configuration window will pop up asking you what and where to save the collector files.
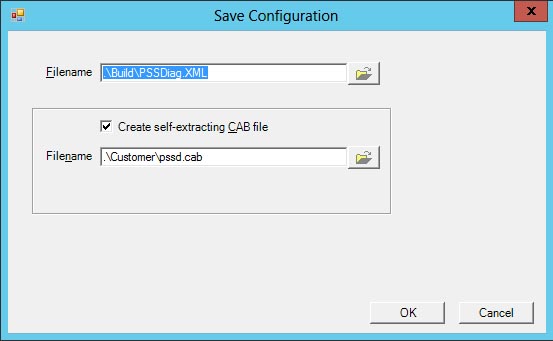
The Filename filed is where you want to save the PSSDiag.XML configuration file as well as all the collection scripts and tools. The option to create a CAB file is where DiagManager will compress and save all the files and scripts from the top folder. The CAB file is just a compressed (ZIP) file, and makes it easier to copy your collection tools to a remote server where the CAB file can then be uncompressed.
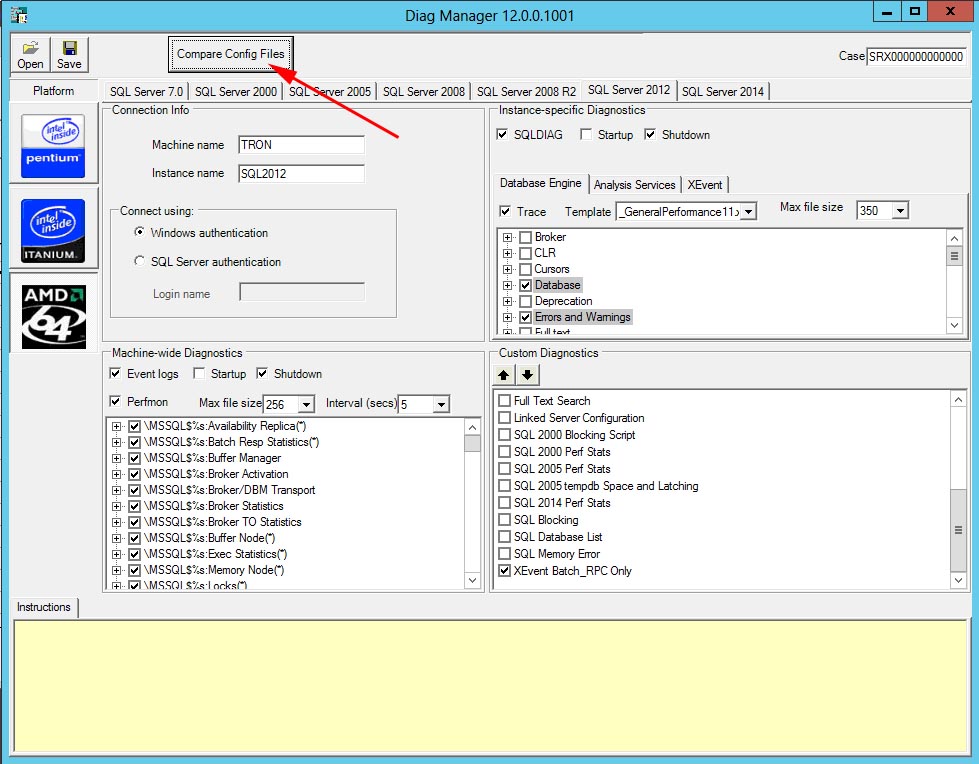
The last option available in DiagManager is the ability to compare PSSDiag.XML files. Just click the “Compare Config Files” button at the top of the window.
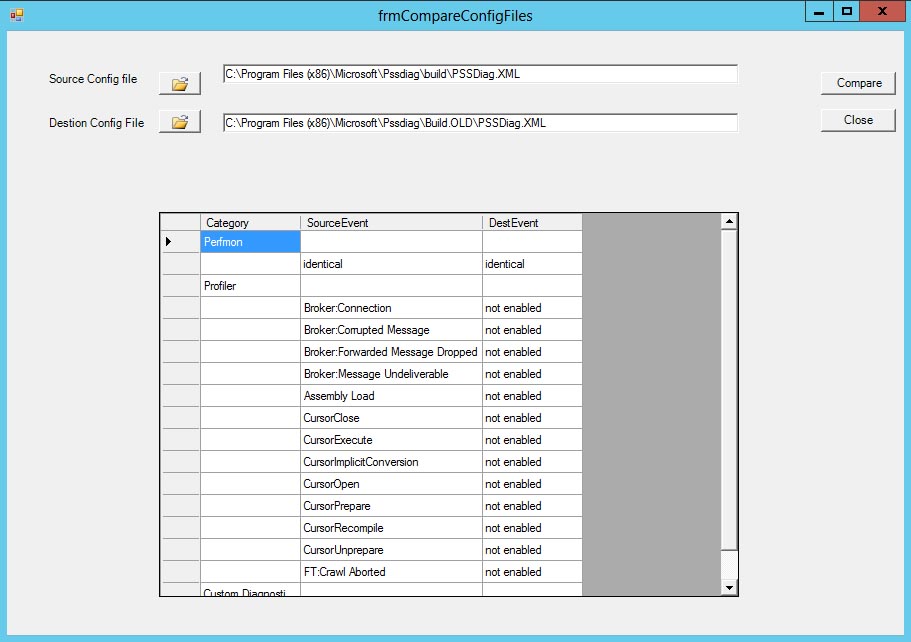
In the popup window, just select the two XML files that you want to compare, click the Compare button, and the output will be shown below.
Once you have created your collection set and/or the CAB file. All you need to do is copy the CAB file to the server to be monitored and execute the pssdiag.cmd batch file.
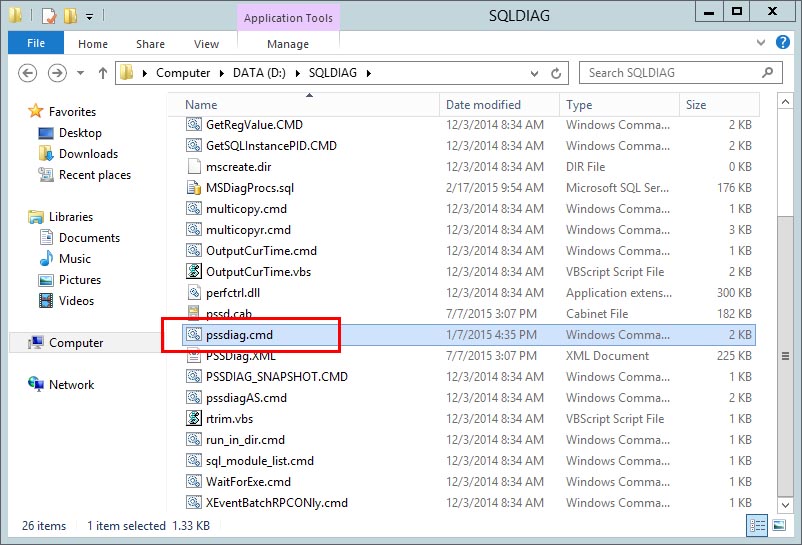
It will open a command prompt window and kick off each of the collection items you specified. Once you see the message “SQLDIAG Collection started” in green-colored font, then you can go recreate your performance issue.
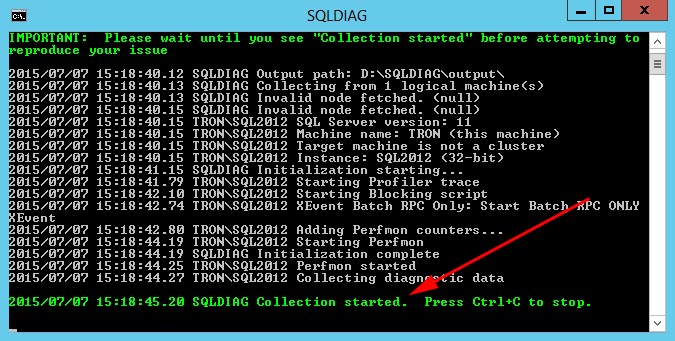
Once you are ready to stop the collection, just press Ctrl+C. All of the data collected will be placed in the output folder, including any custom scripts that you may have created. That output folder can then be copied back to your workstation and fed into SQL Nexus for analysis. See my previous post for a detailed tutorial.
DiagManager definitely has a lot of configuration options to choose from, so learning which ones to use might take time. A good way to get started it is turn off all options except for one, and then run the data capture. Then you can look at the results in the output folder to really understand what that option does.
DiagManager, as well as SQLNexus, was created by the support teams at Microsoft, and they have made both of them freely available to the public to help in troubleshooting issues, so there’s no excuse not to try them out. I hope this tutorial will help you get started.