When I first started poking around in SQL Server 2012, I noticed an extended event session called “system_health” was created by default. It took me a few months before I really dug into the session details to see what it was capturing. But once I did, I was pretty amazed.
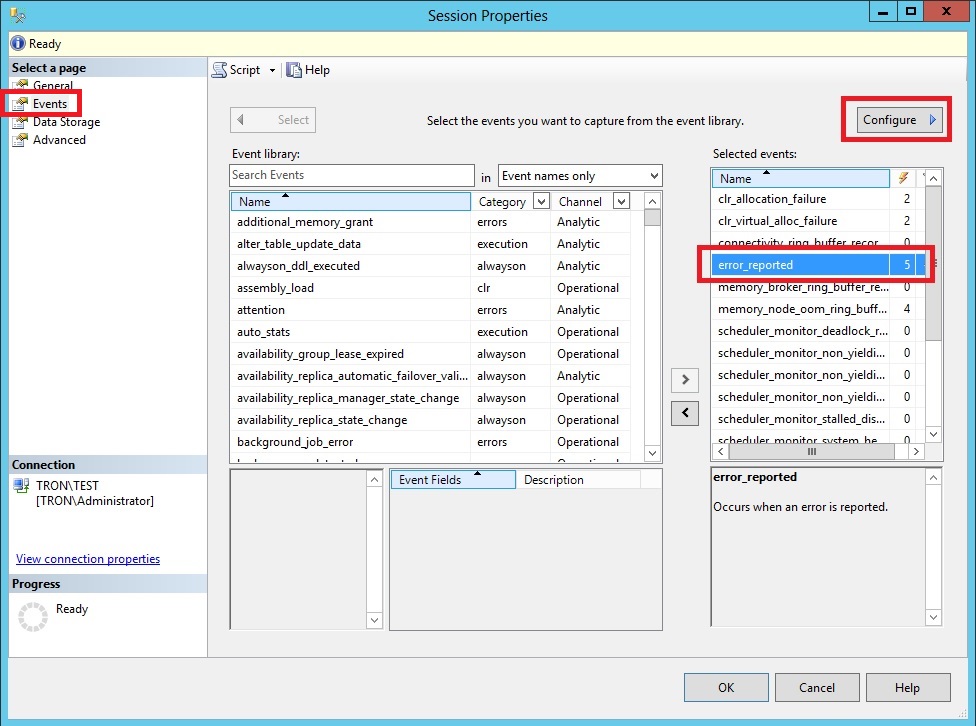
The system_health session starts up by default and collects various performance points that can be used to help troubleshoot issues on the server. To look at the details of it, just right click on the event session and choose properties. This will open the Extended Events UI. Select the events page, and from there you will see each of the events that will be captured. You can see more the details of each event by clicking the Configure button.
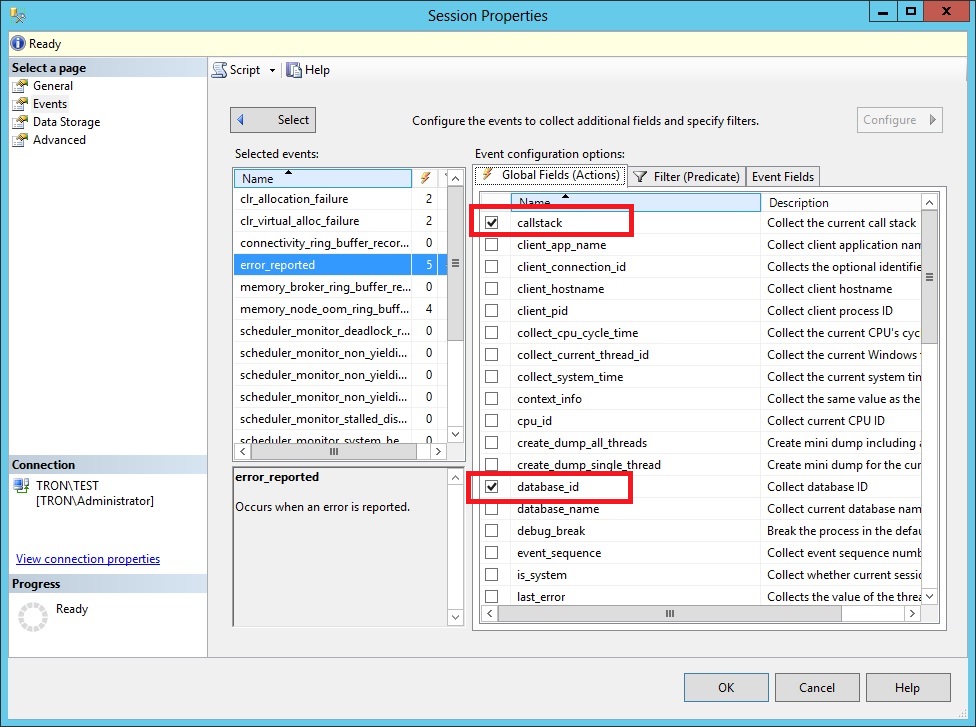
For example, if you select the error_reported event, then click Configure. This will show you the details of which columns will be captured for the event and if there are any predicates defined.
On the Global Fields tab, you’ll see the actions being performed by the session. These are additional collection items that are captured when the event fires. In this case, the session is getting the callstack, database_id, session_id, sql_text, and the tsql_stack fields.
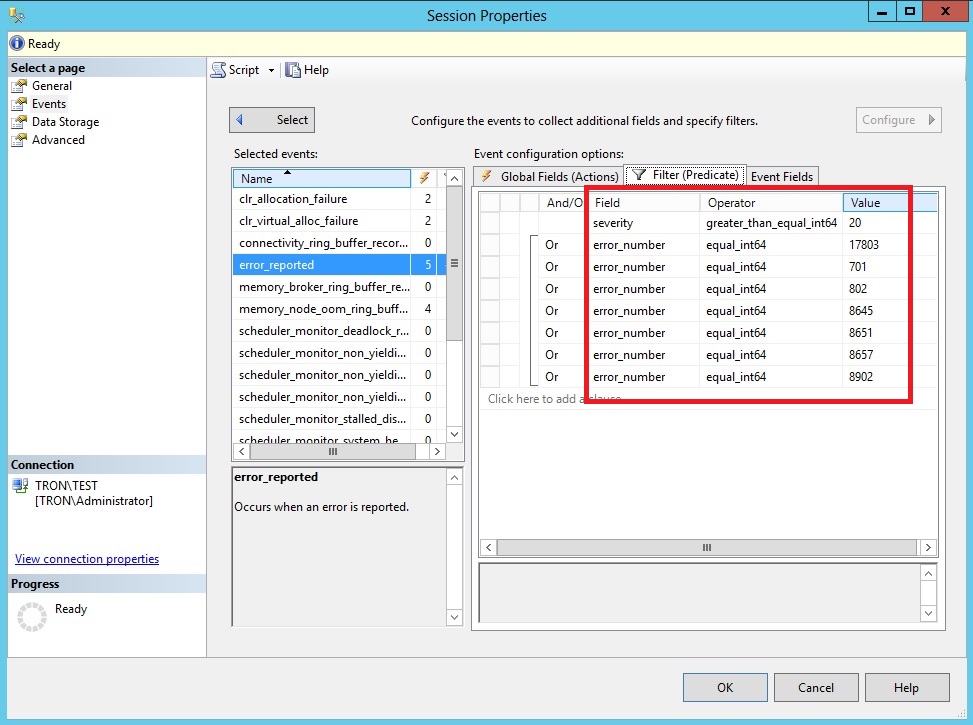
On the filter tab, you’ll see each of the predicates that are defined. This event will fire for error numbers: 17803, 701, 802, 8645, 8651, 8657 and 8902, as well as for any severity greater than or equal to 20. Most of these errors are related to out of memory issues, but the severity 20+ errors are all critical system issues.
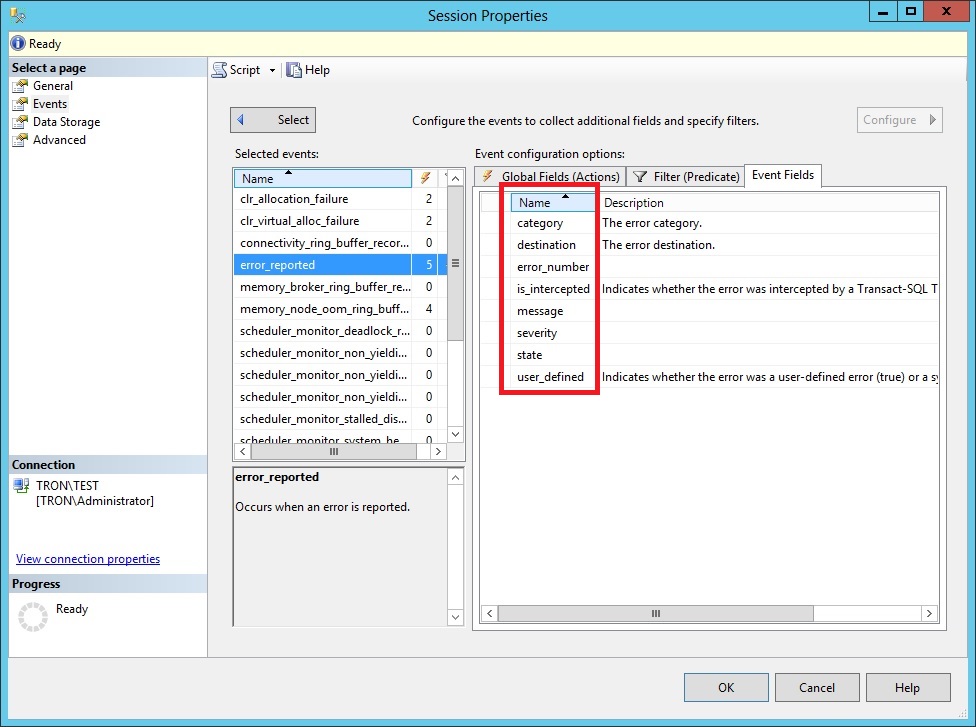
On the Event Fields tab, you’ll see each of the fields that are automatically returned by the selected event; such as the error_number, severity, etc. The fields on this list will change based on which event is selected, because each event is designed to capture different information.
Now click on the Data Storage page. From here you will see each of the targets defined for the session. Targets are nothing more than places the session should store the data it collects. The system_health session as two targets defined; the ring_buffer and to an event_file. The ring_buffer target is an in-memory target designed to only hold the collected data for a short period of time. The event_file target is a file located on disk that holds the collected data.
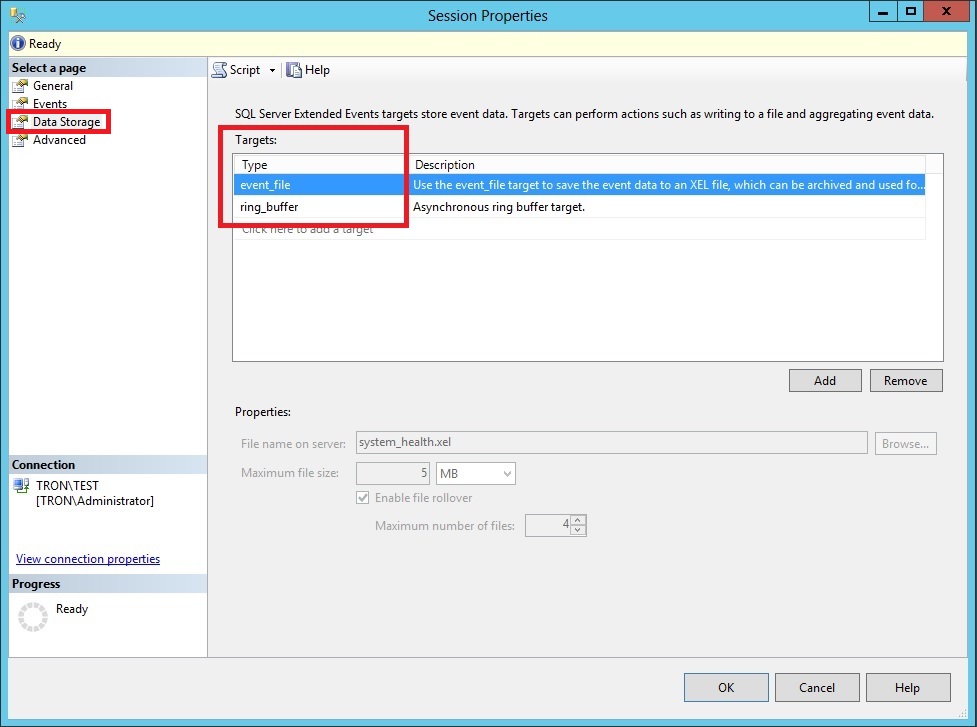
The event_file will be used to retain the collected data for a longer period of time; however, it’s not indefinite. The default file size is only 5MB and the session only keeps 4 rollover files. This means the files could be overwritten within a few short days.
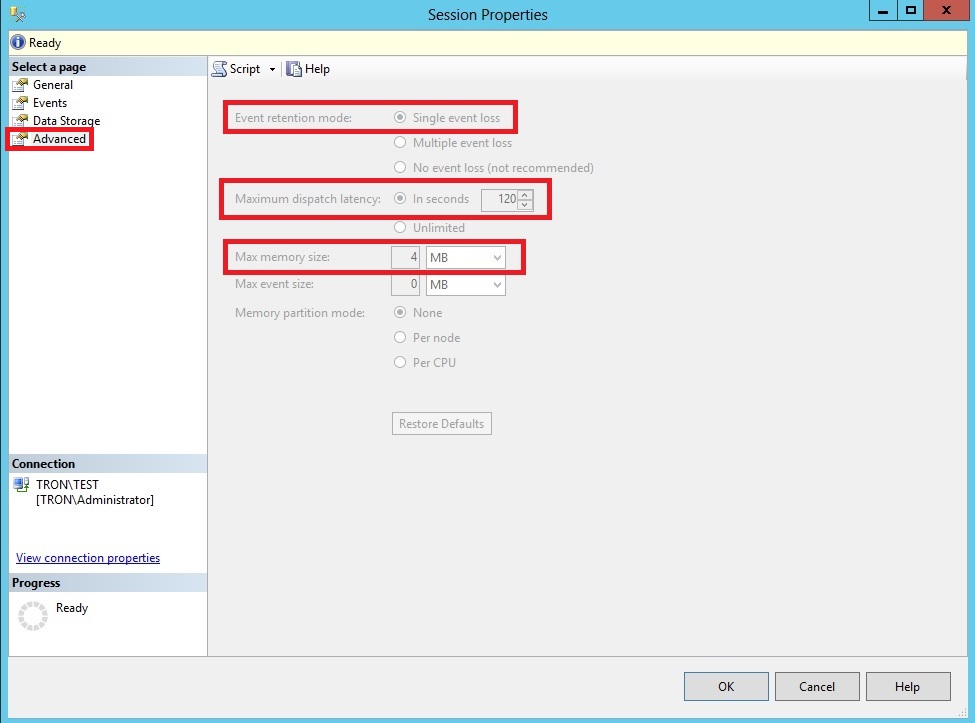
Click on the Advanced page. This section defines some of the global properties of the event session. For example, the event retention mode is set to “Single event loss”. This means if the event buffers fill up before SQL Server can write the events to the targets, it will drop a single event instead of causing significant performance degradation on the server. You can also define the maximum dispatch latency, which forces events to be flushed from memory to the targets at a defined interval. The maximum memory size defined how much memory is used to store the events before flushing them to the targets. Keep in mind that these two properties work in tandem, meaning the events will be flushed to the targets when either the max dispatch latency is reached first or the max memory size is reached first.
Now that we’ve covered what is being monitored, let’s look at how we can use the collected data.
Let’s say we encounter some data corruption within a database. From the errolog, we can see the error message, database ID, and the file and page numbers.
SQL Server detected a logical consistency-based I/O error: incorrect checksum (expected: 0x419b8f57; actual: 0x419bea57). It occurred during a read of page (1:230) in database ID 9 at offset 0x000000001cc000 in file ‘D:MSSQL11.TESTMSSQLDATACorruptDB.mdf’. Additional messages in the SQL Server error log or system event log may provide more detail. This is a severe error condition that threatens database integrity and must be corrected immediately. Complete a full database consistency check (DBCC CHECKDB). This error can be caused by many factors; for more information, see SQL Server Books Online.
To view the captured event session data, we can either right click on the session and click “watch live data” or we can open the event file which is located in the Log folder under the install directory of the instance. The event_file target will always append _0_ and then some long number the end of each file name. The _0_ has no significance, but the number following it is the number of milliseconds since January 1, 1600. This is done to help guarantees filename uniqueness. Once you have opened the file, scroll down to the timestamp of the error and you should see an event called error_reported. Select that event and then you’ll see the event details in the lower window.
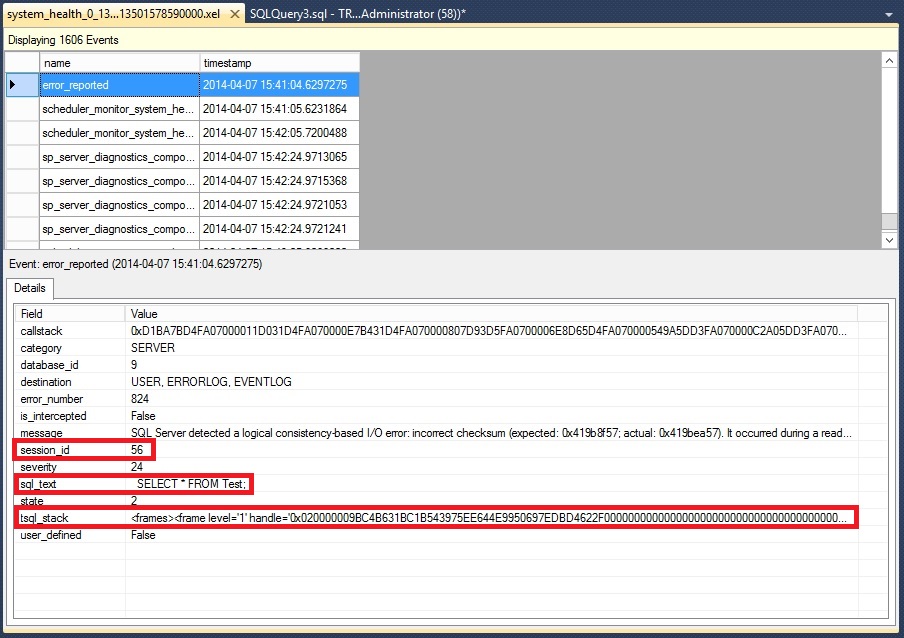
One of the big advantages you’ll notice is the additional data being captured such as the session_id, sql_text, and tsql_stack. These are some of the actions that were define (above) for the session so that SQL Server collected this additional data at the time of the error. While this example may not require you to know the TSQL that was running, this extra info will be very helpful if you run into one of the out of memory errors.
As exciting as the system_health session is, there are a couple of issues I’d like to point out surrounding this session. Anyone with permissions can easily alter or delete the system_health session, whether or not it was a mistake. If this does happen, the entire session can be recreated using the u_tables.sql script. The script is located in the Install folder which is in the default instance folder for SQL Server.
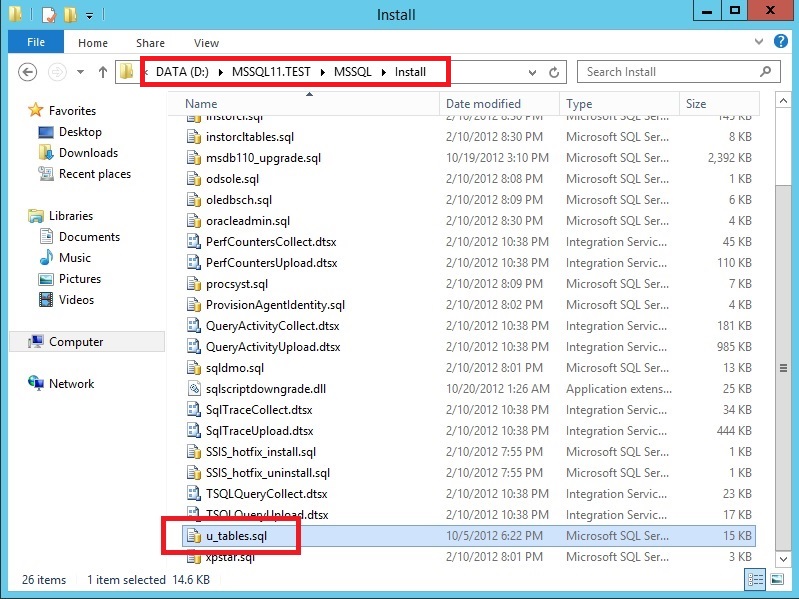
Just open it and scroll down to the bottom of the script and you will see the CREATE EVENT SESSION. Run that section and it will recreate the system_health event session. Reading through that script is also a good way of seeing what each event will capture. The Microsoft product team did a really good job of documenting this script.
The other issue is the settings for the event_file target. The max file size is only 5MB and only has 4 rollover files. In order for the file to retain data for longer period of time, I would suggest changing the max file size to something like 25MB and keep 10 rollover files.
If you’re looking for more info on extended events, be sure to check out Jonathan Kehayias’s blog series “An XEvent a Day”. It’s packed full of goodies about extended events.